Closed-loop disturbance signal estimation
Summary of method capabilities and limitations
A fairly complex closed-loop estimation algorithm has been developed.
The method has been developed by scenario-testing for synthetic datasets, and these tests act as documentation both of what works and what does not work.
Capabilities
For static SISO models (see tests ClosedLoopIdentifierTester_StaticSISO):
- the method is able to determine that the process is steady(zero time constant), and gives acceptable estimates of process gain both in tests where -- disturbance is a step or step-like -- disturbance is a random walk, -- with or without accompanying PID setpoint changes.
For dynamic SISO models (see tests ClosedLoopIdentifierTester_DynamicSISO):
- the method is able to determine that the process is non-zero (non-zero time constant), and gives acceptable estimates for process gain and time constant -- disturbance is a step or step-like -- with or without accompanying PID setpoint changes.
For MISO systems (see tests ClosedLoopIdentifierTester_MISO):
- The solver is able to handle some MISO-cases in scenario tests
Limitations, further work
- In all cases, be it static or dynamic, SISO or MISO, the method gives poor estimates in cases where the disturbance is a pure sinus or sinus-like, and in some random-walk examples the same is seen for systems with nonzero time constants (In most cases where the disturbance is a sinus or sinus-like, the solver detects that the step1 search space is flat and returns the warning
ClosedLoopEst_GlobalSearchFailedToFindLocalMinima). - for MISO-systems but far less effort has been put into this feature and it is less mature.(some code related to MISO-systems has been commented out in a previous refactor, shoudl be added back in further work)
- the solver does not attempt to infer if there is a non-zero time-delay in the process model (this could be addressed in further work)
- the solver does not attempt to infer if the process has a nonlinear curvature term in the process model (this could be addressed in further work)
- the solver ignores FittingSpecs arguments related to de-selecting data outside of specified bound (code has been commented out, could be addressed in further work.)
Workarounds
- a practical workaround is to attempt to fit the model on another dataset with different excitation if warning
ClosedLoopEst_GlobalSearchFailedToFindLocalMinimais seen. - If a system is MISO, a possible workaround is to model the output as a superposition of multiple SISO-systems.
Definitions and motivating example
The disturbance is an additive signal that moves the output of the given unit process. Counter-acting disturbances are the very reason that feedback controllers are used, they observe the deviation between setpoint and measurement of the plant output, and change one-or more inputs to counter-act the disturbance.
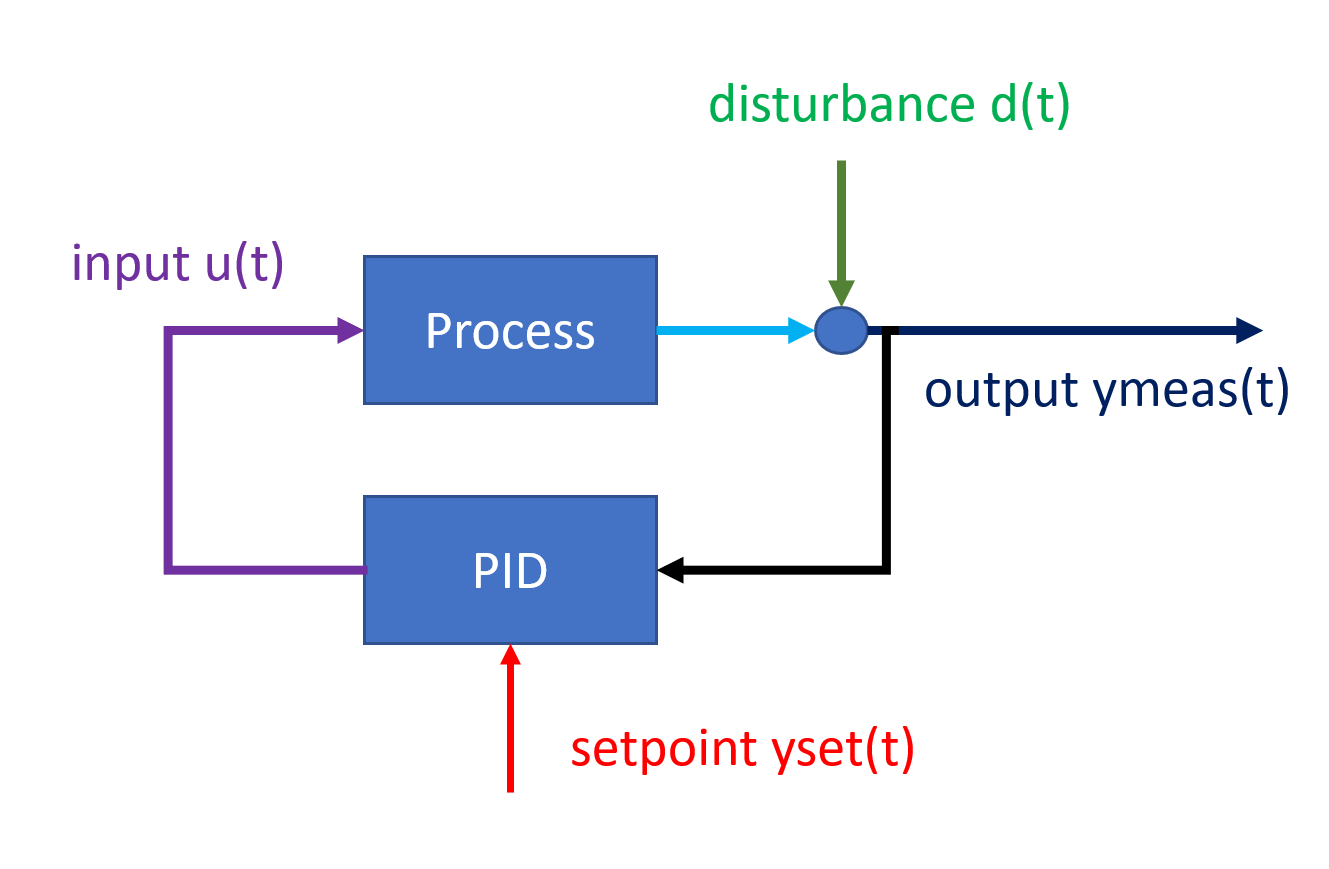
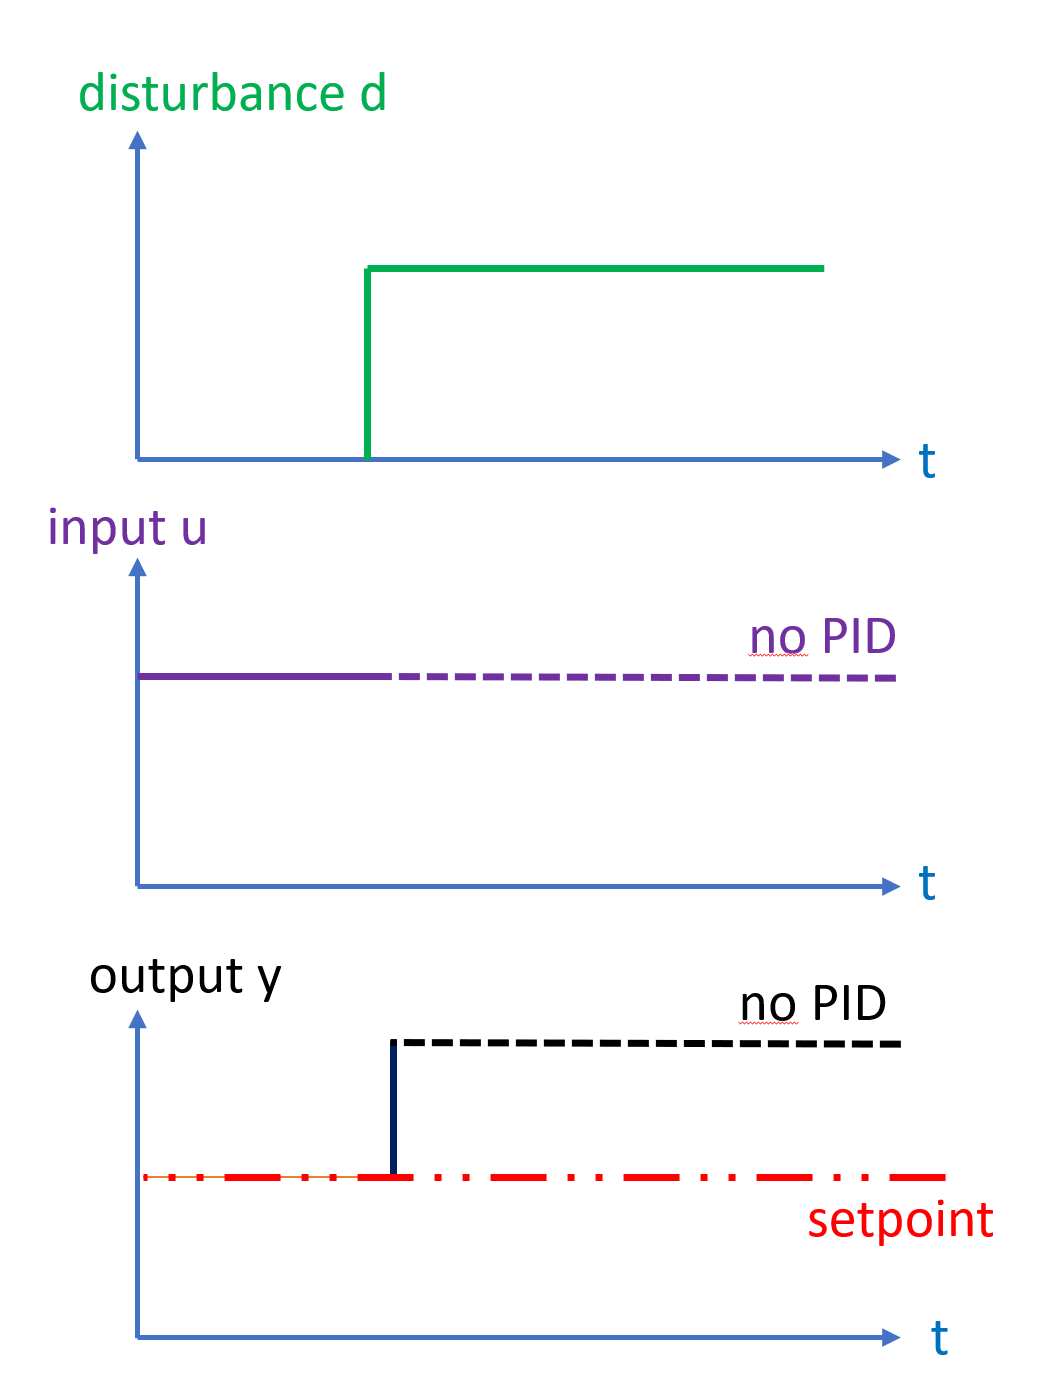
Consider a step disturbance acting on a process without feedback
The feedback is directly fed through to the output, while the input is constant.
Now consider and compare the same step disturbance, but this time a PID-controller counter-acts the disturbance:
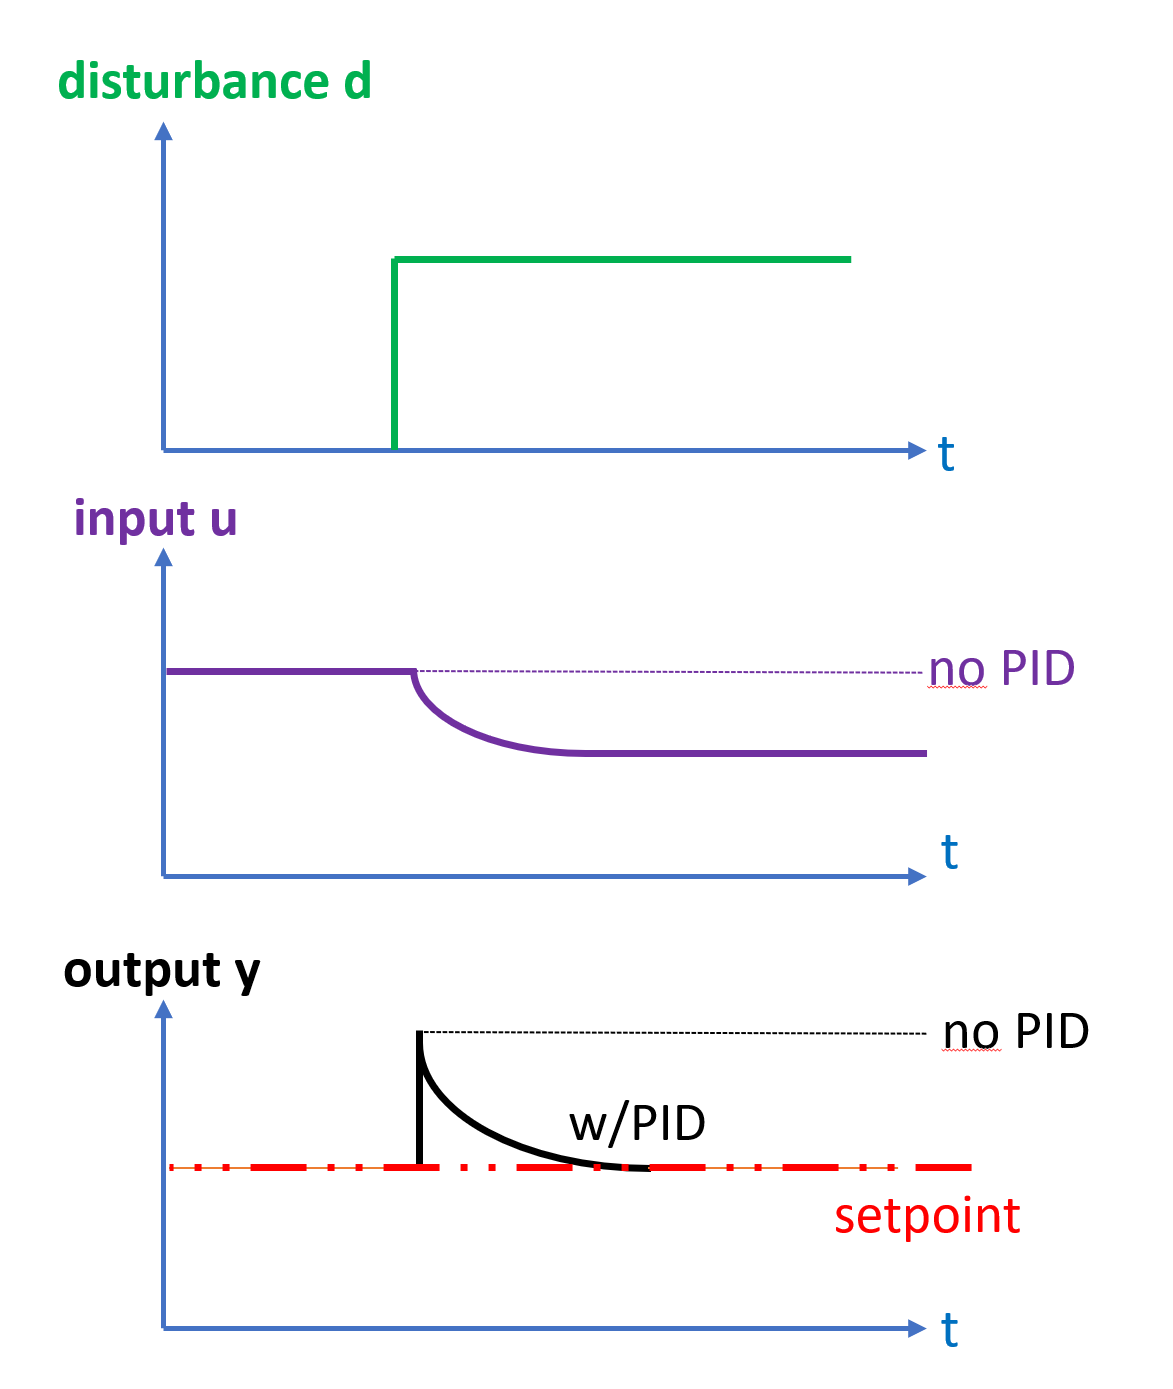
The disturbance initially appears on the process output, then is iteratively with time counter-acted by change of the manipulated variable \(u\) by feedback control, thus moving the effect of the disturbance from the output \(y\) to the manipulated \(u\).
Observing the offset between setpoint and measurement gives a "high-frequency" \(d_{HF}\) response and is seen first, while the change in \(u\) is gradual and "low-frequency" \(d_{LF}\) and the approach will attempt to combine the two as shown below
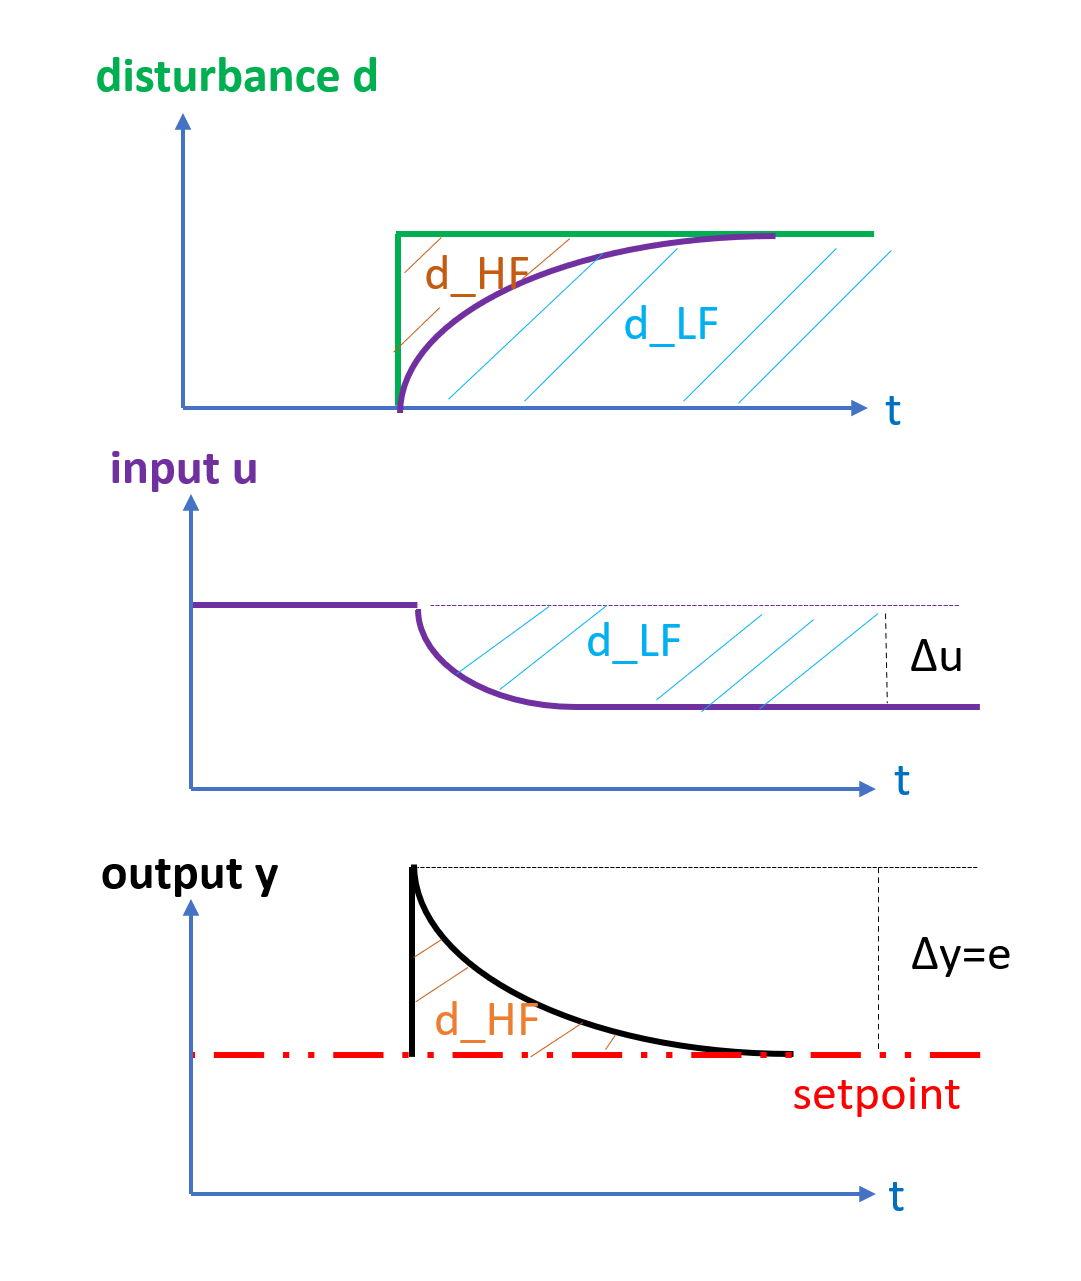
The aim of this section is to develop an algorithm to estimate the un-measured disturbance \(d\) indirectly based on the measured \(u\) and \(e\)
Note
Why is disturbance signal estimation important?
Disturbances are the "action" or "excitation" that causes feedback-controlled systems to move. If disturbance signals could be estimated, then a disturbance could be "played back" in a "what-if" simulation and different changes to the control system could be assessed and compared offline.
The measurement \(y_{meas}\) shows us the combination of the disturbance \(d\) and the process output \(y_{proc}\)
$$y_{meas}[k] = y_{proc}(u[k]) +d[k] $$
Note the above convention for \(y_{proc}\), \(d\) and \(y_{meas}\) are consistent with the convention used by PlantSimulator.
This is important, as the PlantSimulator is used in the estimation of disturbances.
If a model of the process can be determined that is close to the actual process output
$$y_{process} = y_{mod}(u(t)) $$
then an estimate of the disturbance is given by
$$d_{est}(t) = y_{meas}(t) - y_{mod}(u(t)) $$
Note
When the process model is known, then the disturbance is implicitly also known
The above equation shows that when the process model is known, the disturbance signal is implicitly known. The tasks of determining the disturbance and determining the process model are one and the same.
What are the challenges?
The challenge in describing disturbances in feedback-systems is that the feedback aims to counter-act the very disturbance which needs to be described by changing the manipulated variable.
Thus, the effect of the disturbance is in the short-term seen on the system output \(y\), but in the long-term the effects of the disturbance are seen on the feedback-manipulated variable \(u\). The PID-controller will act with some time-constant on \(u\),and this change in \(u\) will again act back on the output \(y\) with a delay or dynamic behavior that is given by the process(described by the process model.) To know what amplitude a disturbance has, requires knowledge of how much effect (or "gain") the change in manipulated variable u will have caused on the output \(y\).
In most cases only a single \(u(t)\) is considered, and this is the pid-output \(u=u_{pid}(k)\).
Note
in general it is hard to know if the observed closed-loop behavior \(y_{meas}\),\(u_{pid}\) is due to a process with large process gain combined with a large disturbances or if the time-series is due to a small process gain and and a smaller disturbances.
Observations
- Note that \(y_{proc}\) is not directly observable unless the disturbance is zero.
- \(y_{proc}\) depends on one or more inputs u(t) that are measured.
- one of the inputs to the \(y_{proc}\) is the output of the pid-controller, which looks at \(y_{meas}\) and tries to counter-act disturbances that enter, thus \(y_{proc}\) and \(d(t)\) will be covariant.
It is in general much easier to determine the gain of the process if there is "external excitation" either
- the pid-controller is set in manual mode and a step change is performed, or
- a setpoint step or some other setpoint change is applied to the pid-controller, or
- (if the process is multiple-input, single-output (MISO), then applying changes to the other inputs also appears to improve the estimate of the process gain)
The aim of this algorithm is to give a sensible estimate of the process gain/disturbance even in cases where there is no introduced excitation. In some cases it will be impossible to determine a unique process gain, but in such cases it would be useful if instead the method returned a range of possible values.
Example: relationship between the time constant estimate and the shape of the estimated disturbance
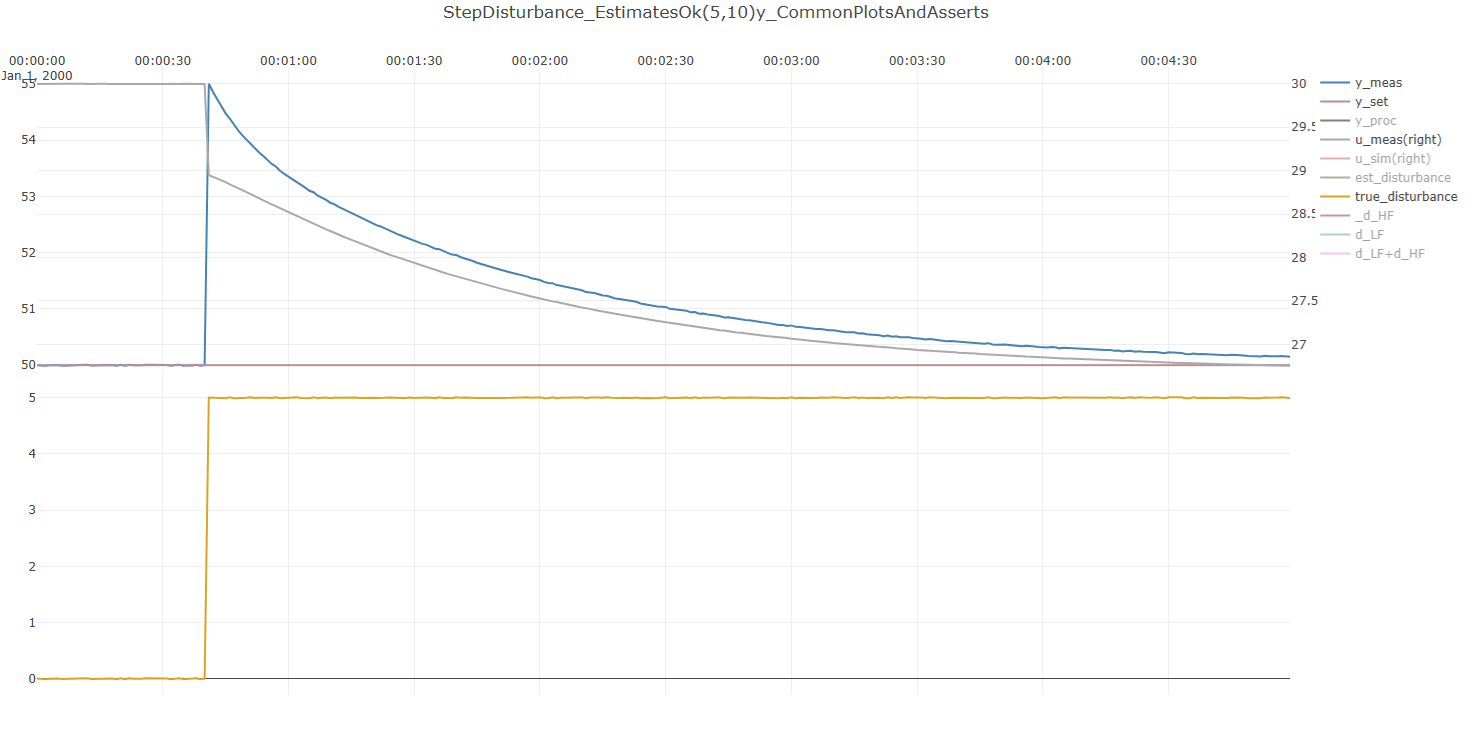
Step disturbance
Consider a step disturbance applied to a linear system with a time constant \(T_c=10s\) and gain \(G=1.5\) as shown above:
It is important to understand how disturbance estimates will vary with different estimates of the time-constant, when
the estimated gain is close to but not exactly equal to the true gain (these estimates will be found with step0 and step1 algorithms
below.)
Given an estimate of the gain of \(G=1.63\), the below image shows how the estimate of the disturbance \(d_{est}\) varies with different process time-constants
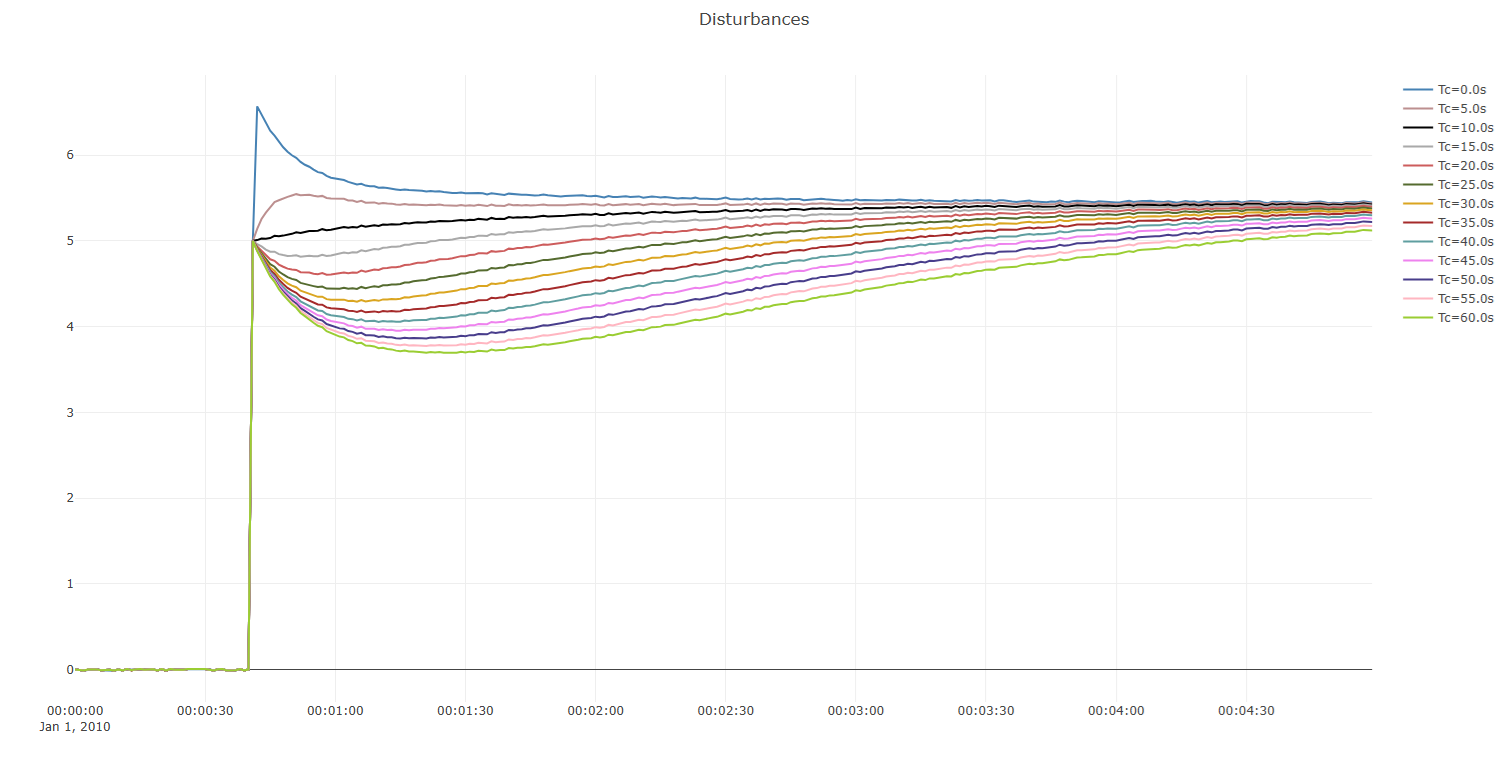
Note that for the "true" value of the time constant \(T_c=10\), \(d_{est}\) has the least transient dynamics, but the farther off from this true value \(T_c\) is, the more transient dynamics have "bled" into the disturbance estimate. An algorithm that tries to minimize an objective function which describes the "cumulative amount of transient dynamics" in the disturbance estimate, could be a used to estimate the time-constant for a given process gain.
Sinus disturbances
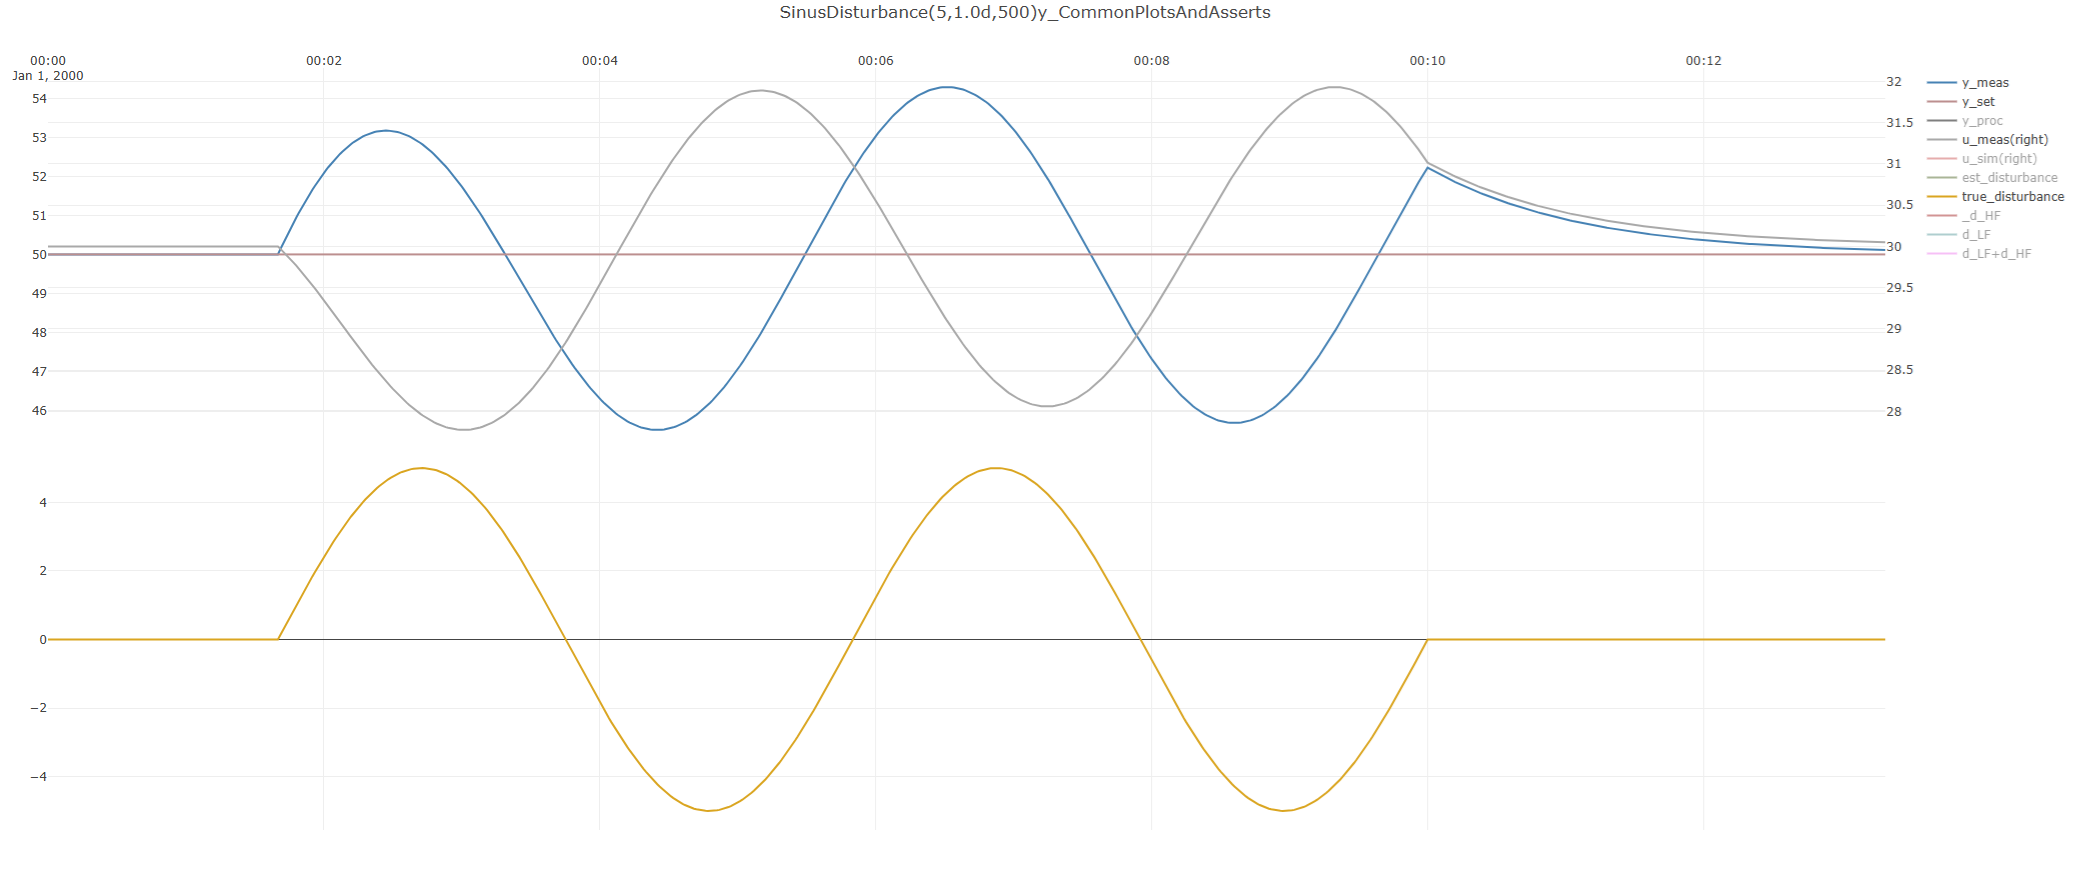
Given as the same linear process above, apply instead a sinus disturbance, between periods of a flat disturbance
As above, we calculate the disturbance estimate for different estimates of the time constant \(T_c\), for an initial gain estimate of \(G=2.02\)
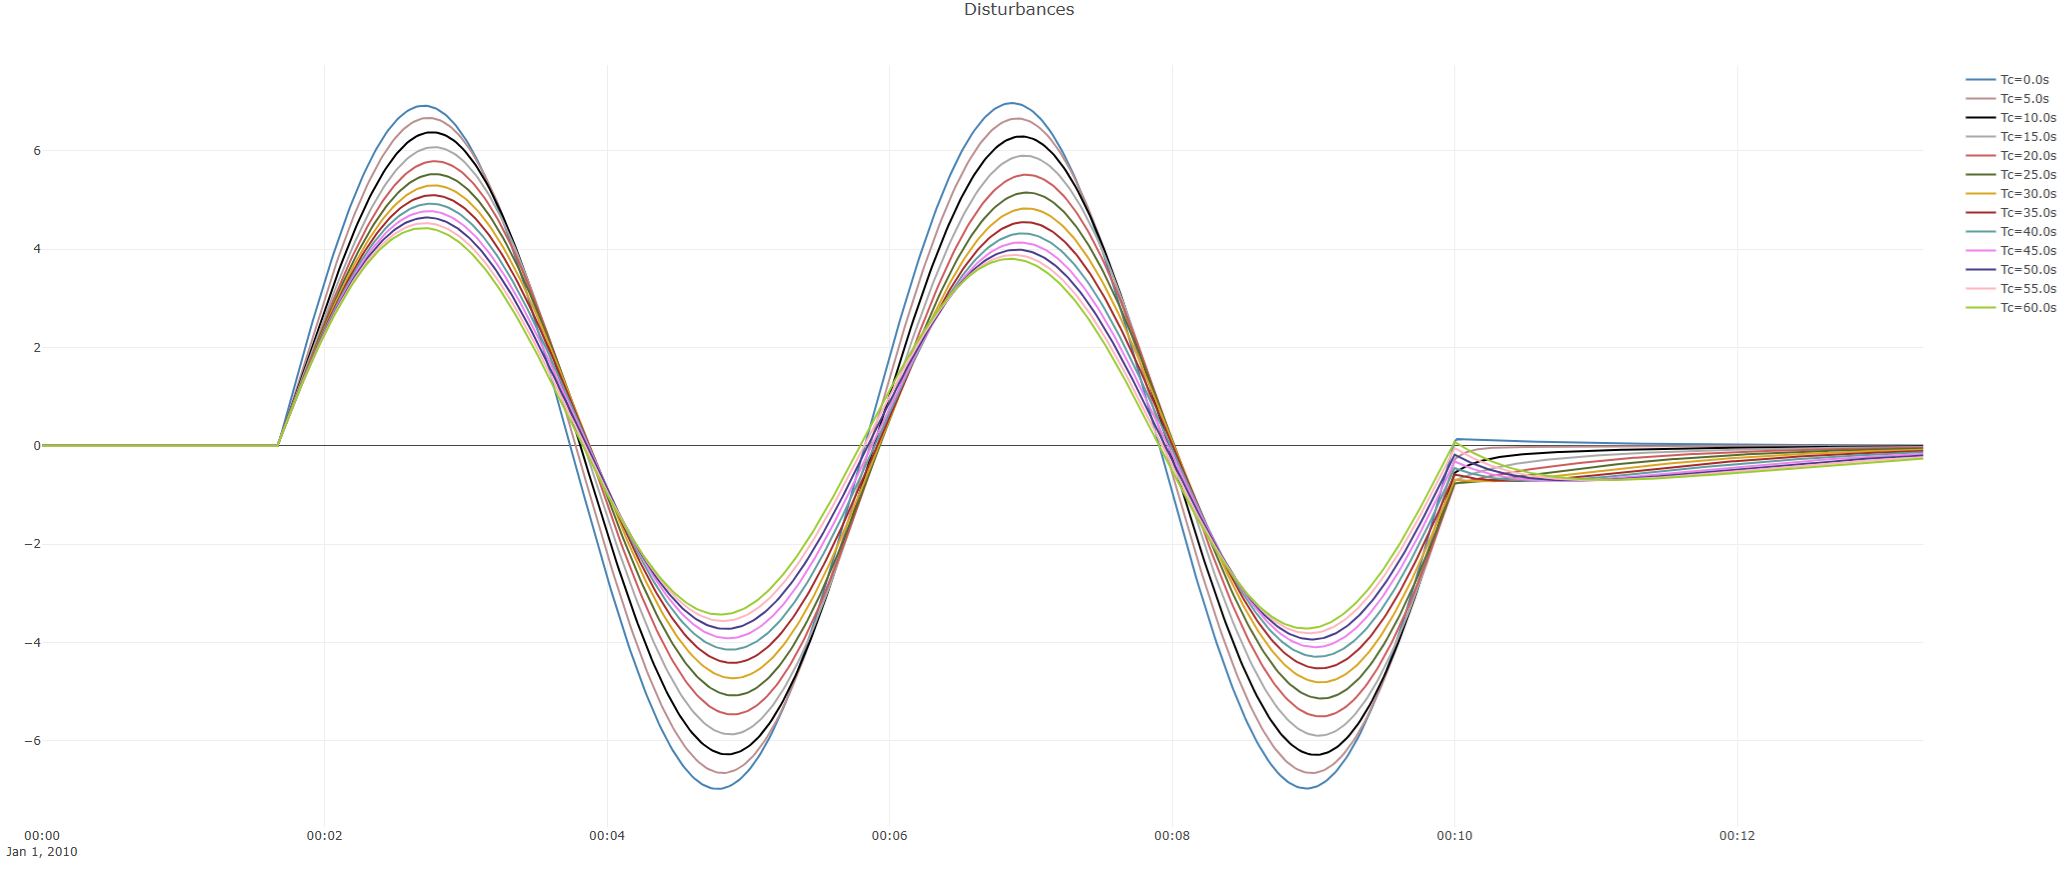
In the case of a sinus disturbance, the disturbance is continuously changing, and and it is no longer easy to discern which of the the above disturbances is the least affected by process dynamics bleeding through. In fact, the disturbances for different time-constants have similar shapes, but the apparent amplitude changes (even thought the process gain is constant).
Discussion
- It could seem that without abrupt changes in the "true" disturbance (like a step-change), it is hard to separate the effects of dynamics (like time-constants) and the effect of gain on the shape of the disturbance.
- Conversely, if there is an abrupt change in the disturbance, it does seem possible to determine the process time constant of the model. An "abrupt change" does not have to be a planned excitation, but for many pid-loops those kind of changes may occur intermittently during normal operations.
- For the above synthetic examples, the \(u_{pid}\), and \(y_{sim} = d_{est} + y_{proc}\) are identical for all time-constants, so are not plotted. Since they are identical, it is not obvious that they can be used to aid in the search for the most likely time-constant.
Approach
Sequential Gain-Time Constant Identification for Closed-Loop Disturbance Reconstruction
The goal of the method is to find a UnitModel that describes the process that the PidModel is controlling, based on measured time-series data.
The terms in the UnitModel listed in terms of their relative importance are:
- process gain (most significant)
- process time constant
- process time delay (not currently implemented)
- process curvature (not currently implemented,least significant)
Note
All terms in UnitModel are important
Failure to describe time-delays or curvatures may cause poor match in process gains and time constants.
Thus all terms in the UnitModel are actually important.
The method attempts to exploit co-simulations of PidModel and UnitModel in the PlantSimulator, and that these simulations are
- very computationally inexpensive (i.e. can be run numerous times), and
- the simulations can be fully automated.
The method can be classified as disturbance reconstruction, as for each candidate UnitModel a disturbance signal is inferred,
and the closed-loop system is simulated with this disturbance.
Determining the process gain and time constants are coupled. As the process gain has the most influence on the resulting simulations, it is chosen to determine it first.
The chosen approach to attempt to deconstruct this problem is sequential estimating
process gain and process time constant (as opposed to solving simultaneously).
Each sequential step uses a form of global-search or trial-and-error to simulate the system for numerous values, and then attempts to rank
the resulting simulations to determine the most promising estimate.
A large number of synthetic datasets with known solutions are used to guide the design of the algorithm, and to classify the properties and performance of the method:
- step disturbances
- random walk disturbances
- sinusoidal disturbances
- sinusoidal disturbances and a setpoint step change
- step disturbance and setpoint step change
Note
In other parts of the library objective metrics that describe the fit between modelled and measured output are used to select models. In closed-loop, this kind of scoring is much less cut-and-dry, because by our definition, the disturbance signal is all parts of the measured output \(y_{meas}\) that the process model is unable to describe with \(y_{process}\), thus the disturbance signal may include model errors, and usually \(d_{est}\) results in \(y_{meas}=_{process}+d_{est}\), so that the deviation between measured and modelled output (including disturbance) is zero.
The accumulated traveled travel \(Q\) of a signal we defined as :
This metric is used extensively in the below algorithm.
Algorithm outline
This algorithm is implemented in the class ClosedLoopUnitIdentifier, as follows:
given an estimate of the PidModel from prior knowledge or from PidIdentifier:
- choose indices to ignore (bad or frozen portions of data)
- use a heuristic to get an initial static "model-free" guess for the process model (process gain and -sign) (
step0) - set heuristic broad search range for the process gain \([G_{min},G_{max}]\)
- one "pass"
- taking the best current guess of process time-constant, estimate the process gain by a global search between \([G_{min},G_{max}]\) (
step1) - taking the best process gain from step1, estimate the process time-constant(
step2)
- (try to improve the model by testing time-delays)(not implemented)
- reduce the range of \([G_{min},G_{max}]\) around the value found in
step1and do another pass, or exit if pass did not find an improved gain.
- taking the best current guess of process time-constant, estimate the process gain by a global search between \([G_{min},G_{max}]\) (
The algorithm is given a number of design constants that have been determined by trial-and-error
MaxNumberOfPasses: the maximum number of passes (usually \(4\))LargestTimeConstantTimeBaseMultiple: the largest time-constant to consider (expressed as a multiple of the time base)Step1GlobalSearchNumIterations: the number of different process gains within the given bounds to try for each given step (an array)Step1GainGlobalSearchUpperBoundPrc: the upper bounds of each the gain global search, express as a percentage of the current estimate (an array)Step1GainGlobalSearchLowerBoundPrc: the lower bounds of each the gain global search, express as a percentage of the current estimate (an array)
Step1GainGlobalSearchUpperBoundPrc and Step1GainGlobalSearchLowerBoundPrc are set to be wide for the first pass, and then narrow for each subsequent pass.
The number of total simulations across four passes is set to be around ~50, and the order of magnitude of computational time required to reach a solution is typically \(0.1\)-\(2\) seconds for datasets with \(N=1000\).
Note
Convergence
- Good performance is usually achieved within 2-4 passes is usually sufficient in unit tests with known true parameters.
- In general the bound on the gain need to be wide enough that the true value is hopefully not outside the initial bounds, but also the wider the bounds the more distance between each attempted gain for a given number of runs. How wide to chose these bounds, and how much to narrow the bounds for the second pass are heuristically set (based on performance in unit tests).
- There is no sense doing a second pass if the steps 1 and 2 did not cause any change in parameters (in which case only one pass is done)
- In general there is no guarantee that a sequential optimization will converge, but the method usually does so in practice if information exists in the data set
- If the data has a insufficient level of excitation, it sometimes happens that the algorithm is unable to produce estimates in step1 and step2 that improve on step0. This is a strong indicator that identification should be re-done on another dataset at a later time.
Step 0
The first, model-free estimate of the process gain
The idea of the initial estimate gain is to get an idea of the approximate value of the process gain, which will determine the bounds for global search in subsequent steps.
A model-free estimate of the disturbance is required to initialize subsequent sequential estimation.
For the first iteration, all process dynamics and non-linearities are neglected, a linear static model essentially boils down to estimating the process gain.
Let the control deviation \(e\) be defined as
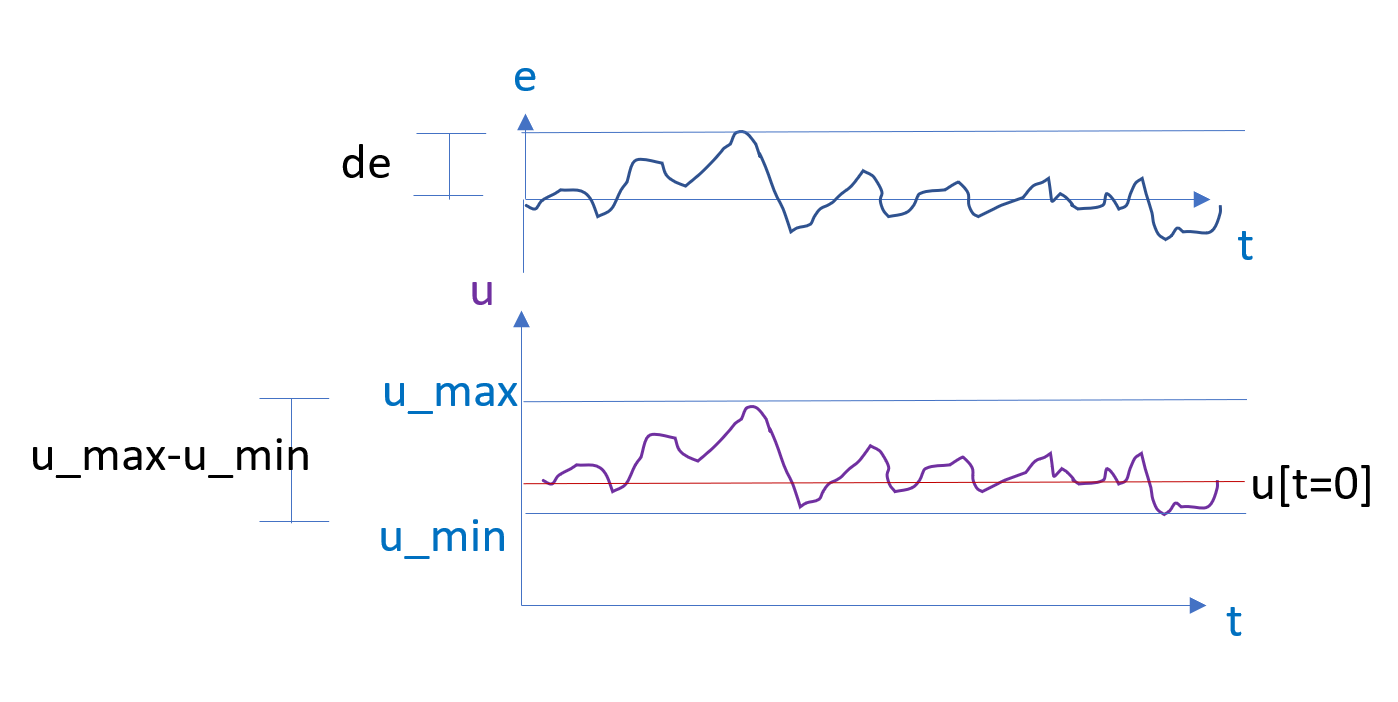
This first estimate of the process gain \(G_0\) in a linear model \(y(t) = G_0 \cdot u(t) + b\) is found by the approximation
The PID-controller integral effect time constant meant that a peak in the deviation \(e\) will not coincide with the peak
in \(u\).
The idea of creating an initial estimate with min and max values is that it circumvents the lack
of knowledge of the dynamics at this early stage of estimation.
Given the gain an initial UnitModel is created with a rudimentary bias and operating point \(u_0\), so that the model can
be simulated to give an initial \(y_{mod}(u)\), so that an estimate \(d_{est}(t)\) can be found.
Note
Step 0 dynamic artifacts in the estimated disturbance
Because no process dynamics are assumed yet, \(d_{est}(t)\) at this stage will include some transient artifacts if the process has dynamics. \(d_{est}(t)\) will be attempted improved in subsequent steps.
It has been observed in unit tests that this estimate in some cases is spot on the actual gain, such as when the disturbance is a perfect step.
It seems that the accuracy of this initial estimate may depend on how much the process is close to steady-state for different disturbance values, as disturbance step produces far better gain estimates than if the disturbance is a steady sinus(so that the system never reaches steady-state.)
Step 0: Guessing the sign of the process gain
Methods for open-loop estimation when applied naively to closed-loop time-series often estimate process gain with incorrect sign.
The reason for this is that cause-and-effect relationships are different in closed- and open loop.
It is thus important to use an identification algorithm that is intended for closed loop signals, and to also include information about the setpoint \(y_ {set}\) to the algorithm, so that the algorithm can infer about the control error \(e\).
Note
Counter-intuitive input/output relationship in closed-loop systems
As an example, if inputs \(u\) and output \(y\) increase in unison, you would in the open-loop case assume that the process gain is positive. In the closed-loop case, the same relation between input and output change is often indicative of a negative process gain. In the closed loop, a disturbance enters the output \(y\), is counter-acted by the controller output \(u\), so an increasing \(u\) in response to an increasing \(y\) would be because the sign is negative. The inverse is also true, what appear to be negative process gains at first sight may in closed-loop be positive process gains.
The strategy that is employed by the algorithm is to require the PID-parameters to be identified prior to running the closed-loop identifier, and to use the sign of the Kp in these parameters to set the sign of the process gain.
Step1
The initial guess for the process gain and process gain sign above have not considered the pid-controller and its dynamics, including any setpoint changes that the dataset may contain.
Step1 is different if there are setpoint changes in the given dataset versus when there is not, as described below.
in the case of setpoint changes
The PID-model and process model is simulated for a given gain \(G\) in a closed loop with no disturbance acting on it, but where the actual setpoint
signals and any external model inputs u are applied. This results in a simulation of what the output $y_{meas}$ would have been if the disturbance was zero
This gives an disturbance-free (adjusted)pid-output \(u_{pid,adj}\)
It has been observed that the process gain \(G\) that results in the smallest \(Q(u_{pid,adj}(G))\) is a good estimate of the true process gain in unit tests where the true gain is known in advance.
Note
The above works equally well in the case that process to be simulated is a multiple-input system and the other non-pid inputs are changed during the tuning set.
in the case of no setpoint changes
If there are no setpoint changes, the above method of determining the process gain will not succeed, as the objective function will be flat.
In this case, the global search instead attempts to find the process gain that results in the disturbance that "travels the shortest distance", expressed as:
Note
- this method is heuristic
- the objective usually has a minimum, but not always (such as if the disturbance is a perfect sinus in unit tests)
- the objective space is fairly flat, the minimum has a fairly low "strength", i.e neighboring process gains have almost equally low objectives
- the objective space seems to be more concave ("stronger" i.e. more significant minimums) when the process gain is higher.
Step 1minQ algorithm:
- given an initial process model (with a zero or nonzero time-constant) and an estimate of the PID-model(including \(K_p\))
- given a range \([G_{min}, G_{max}]\)
- for a number of gains \(G\) between \(G_{min}\) and \(G_{max}\)
- calculate the resulting disturbance \(d_{est}(G)\) and \(u_{pid,adj}\) (using
PlantSimulator) - calculate \(Q(u_{pid,adj})\)
- calculate the resulting disturbance \(d_{est}(G)\) and \(u_{pid,adj}\) (using
- chose the "best" gain by a number of criteria
- "v1": if setpoint is flat and no other inputs, chose the gain that minimizes \(Q(u_{pid,adj}(G))\) (unless solution space is flat)
- "v2": if the setpoint is changing chose the gain that minimizes covariance between \(d_{est}(G)\) and setpoint(unless solution space is flat)
- "v3": if the is more than one input chose the gain that minimizes covariance between \(d_{est}(G)\) and other input(unless solution space is flat)
- "v4": if solutions space for the above three are all flat, look if any gain minimizes \(Q(d_{est}(G))\) (only if this solution space has a minima not at the extremes)
Note
Better estimates when set-points change, "v4" is weak link in algorithm
The algorithm seems to in general give better estimates of the process if there are step changes in the external inputs
or in the pid-setpoint, and the algorithm appears to be able to handle both cases. The "v4" objective is the current weak link of the
algorithm, and adding other criteria for scenarios when v1-v3 are flat solution spaces should be a topic for further work.
Often there is no minima in the v4 solution space, and the sequential solver fails to improve on the heuristic initial estimate, and also fails
to find a time-constant(as it never gets to step2).
Step2
If the process is actually dynamic yet is modeled as static, then the above methodology will result into un-modeled transients bleeding into the estimated disturbance, where they will appear as "overshoots", 2.order dynamics in the estimated disturbance. These un-modeled transients may cause process gains and disturbance estimates to be skewed slightly too large, unless the transients can then be modelled
Note
The applied principle for determining process time constants in close-loop
If every change in \(e(t)\) is followed by similar transient in \(d(t)\) then this is a sure sign that there is un-modeled dynamics, if these "transients" can be described by adding dynamic terms to models and this causes a "flatter" estimated disturbance, then this is usually preferable.
In step 2, the model found in step 1 is modified by attempting to add add larger and larger time constants to the identified model, and analyzing the accumulated absolute travel \(Q\),
for the estimated disturbance vector \(d_{est}\).
Step 2 minQ algorithm:
- given an initial process model (with a nonzero process gain)
- if first pass:
- start at \(T_c=0\)
- while the \(Q(d_{est}(T_c))\) keeps decreasing:
- calculate \(d_{est}(T_c)\) for the given \(T_c\) (using
PlantSimulator) - increase \(T_c\)
- calculate \(d_{est}(T_c)\) for the given \(T_c\) (using
- for subsequent passes:
- seek through \(Q(d_{est}(T_c))\) for [0, T_{c,pass1}] (using
PlantSimulator) - choose the \(T_c\) with the lowest \(Q(d_est{est}(T_c))\)
- seek through \(Q(d_{est}(T_c))\) for [0, T_{c,pass1}] (using
Performance, conclusions and further work
In unit tests summarize the expected performance for different types of use-cases
- step-disturbances accuracy to within 5% is for static processes and 10% for dynamic processes are typical
- random-walk disturbances accuracy to within 12-25% for static processes, but very poor accuracy for dynamic processes.
- sinus-disturbances poor accuracy for dynamic and static processes.
- the method is able to remove data points to be ignored from the analysis (bad data points) and still succeed
- the method does well even for multiple-input systems provided that there is excitation in the non-pid controlled inputs (in fact this appears to make estimation easier.)
Conclusions
- The algorithm seems to work well on certain types of common disturbances where the process is close to steady-state but then intermittently is excited (
step disturbances). - The algorithm struggles if the disturbance is so "rich" that the system in fact never reaches steady-state(such as in the case of a random-walk or sinus).
- In situations where the algorithm does poorly, the algorithm is usually not able to improve on the
step0initial estimate, typically because global search does not reveal any minimum in any of the considered metrics inpass1. - If the method is unable to improve on the
step0, it is recommended to re-identify the model on other data until the algorithm converges over two passes.
Further work
look into adding other criteria for
Pass1that can help the sequential optimization in situations where the existing "v1","v2","v3" and "v4" do not reveal any minima, and thus the heuristic estimate ofPass0may be returned.look into the unit tests where it is attempted to estimate multiple-input single-output systems with non-zero disturbance.(
Static2Input_NOdisturbanceWITHsetpointChange_ExtUChanges_detectsProcessOk)
Note
Some code related to multiple-input single output systems was commented out of ClosedLoopUnitIdentifier on a previous refactor.
This code should be worked back into the use.
Side-note: Alternative method to estimate process gain based on \(d_{LF}\)
Refer to the example at the top of this section.
The disturbance can be imagined as having two distinct parts:
- a high-frequency part \(d_{HF}\) that depends on \(e(t)\), and
- a low-frequency part \(d_{LF}\) that depends on \(u(t)\) and it is assumed that
There are essentially two ways of calculating the disturbance
- By subtracting the modelled \(y_{proc}(\hat{u})\) from \(\bar{y}\) : \(d_{est} = \bar{y} - y_{proc}(\hat{u})\)
- By \(d_{est} = d_{HF}(\hat{u}, y_{set}) +d_{LF} (u)\)
where \(d_{LF} (u) = \hat{y}(u(t))- \hat{y} (u(t_0))\)
Note that \(d_{HF}\) does not change with changing estimates of the model gain or other parameters, while \(d_{LF}\) does.
The algorithm in the above sections struggles most in the case that the disturbances are relatively flat, while there are no setpoint changes, so that there is a general lack of excitation.
In those cases \(d_{LF}\) may be small, and so it may be possible to aid estimation by assuming \(d_{est}(t) \approx e(t)\) or even \(d_{est}(t) \geq e(t)\)
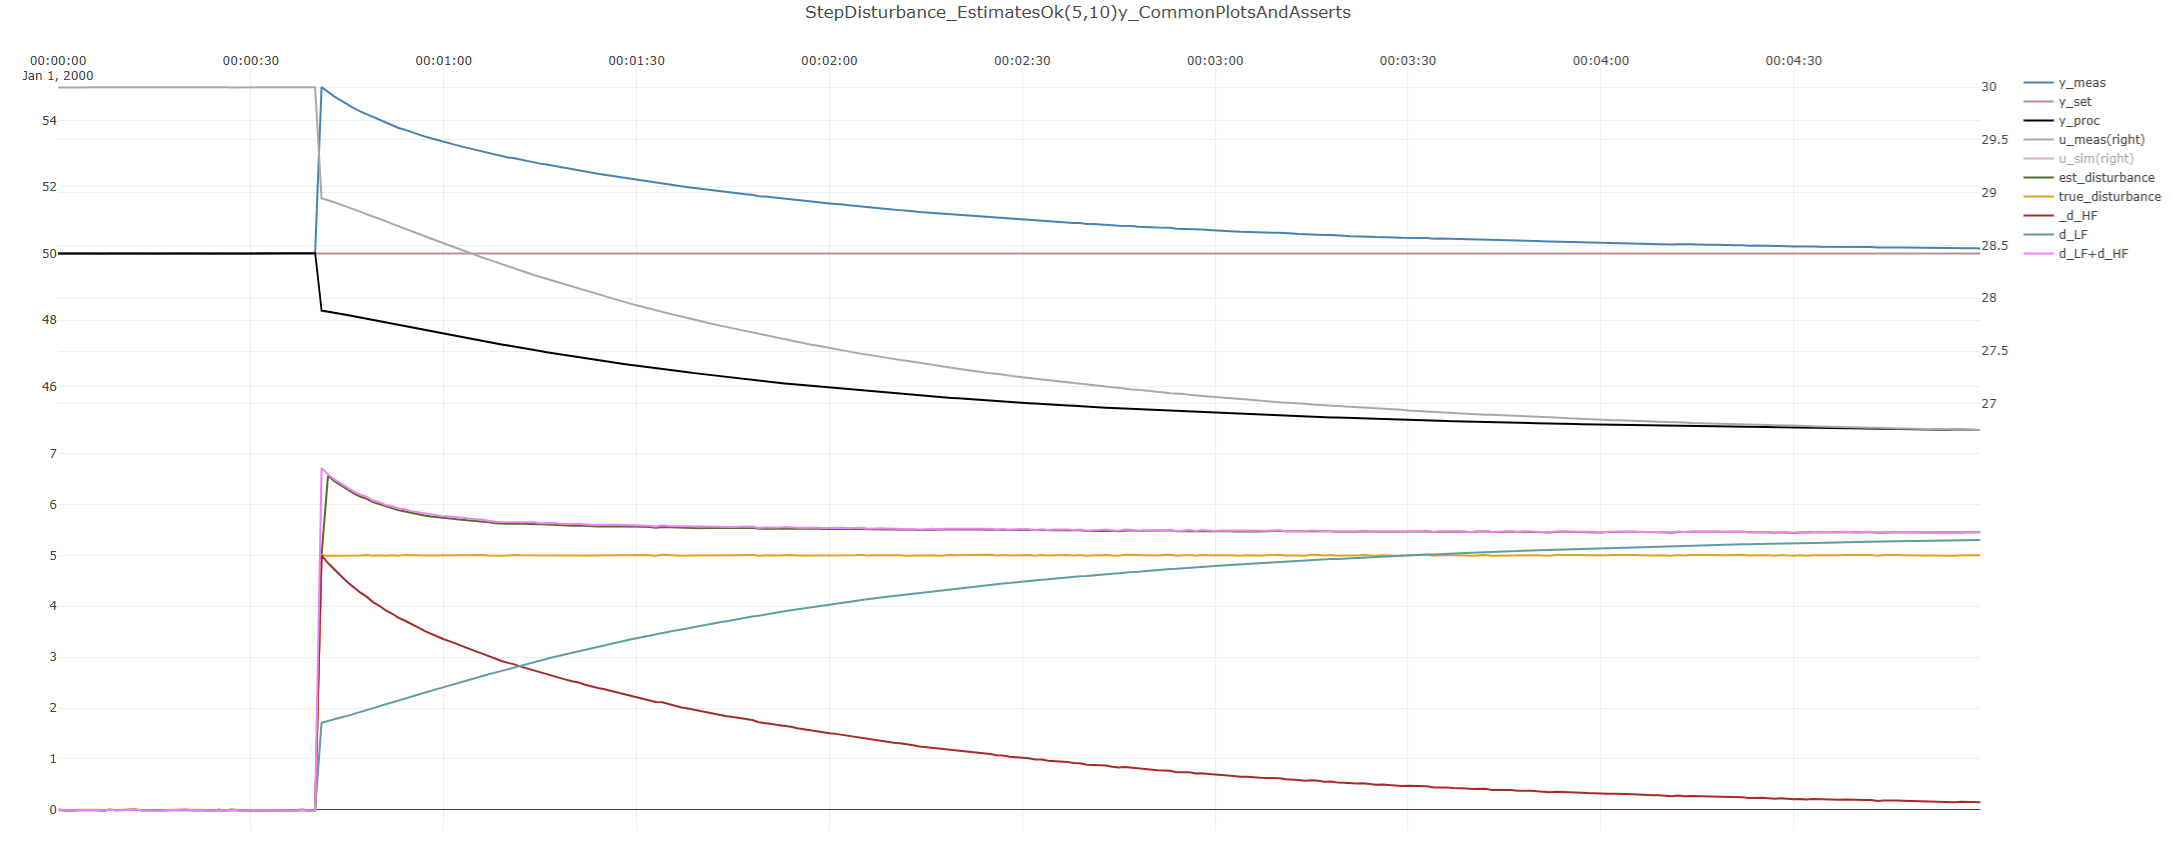
Step disturbance
The same "step disturbance" example as higher in this section is revisited, and plotting \(d_{LF}\) and \(d_{HF}\), and their sum:
Sinus disturbance
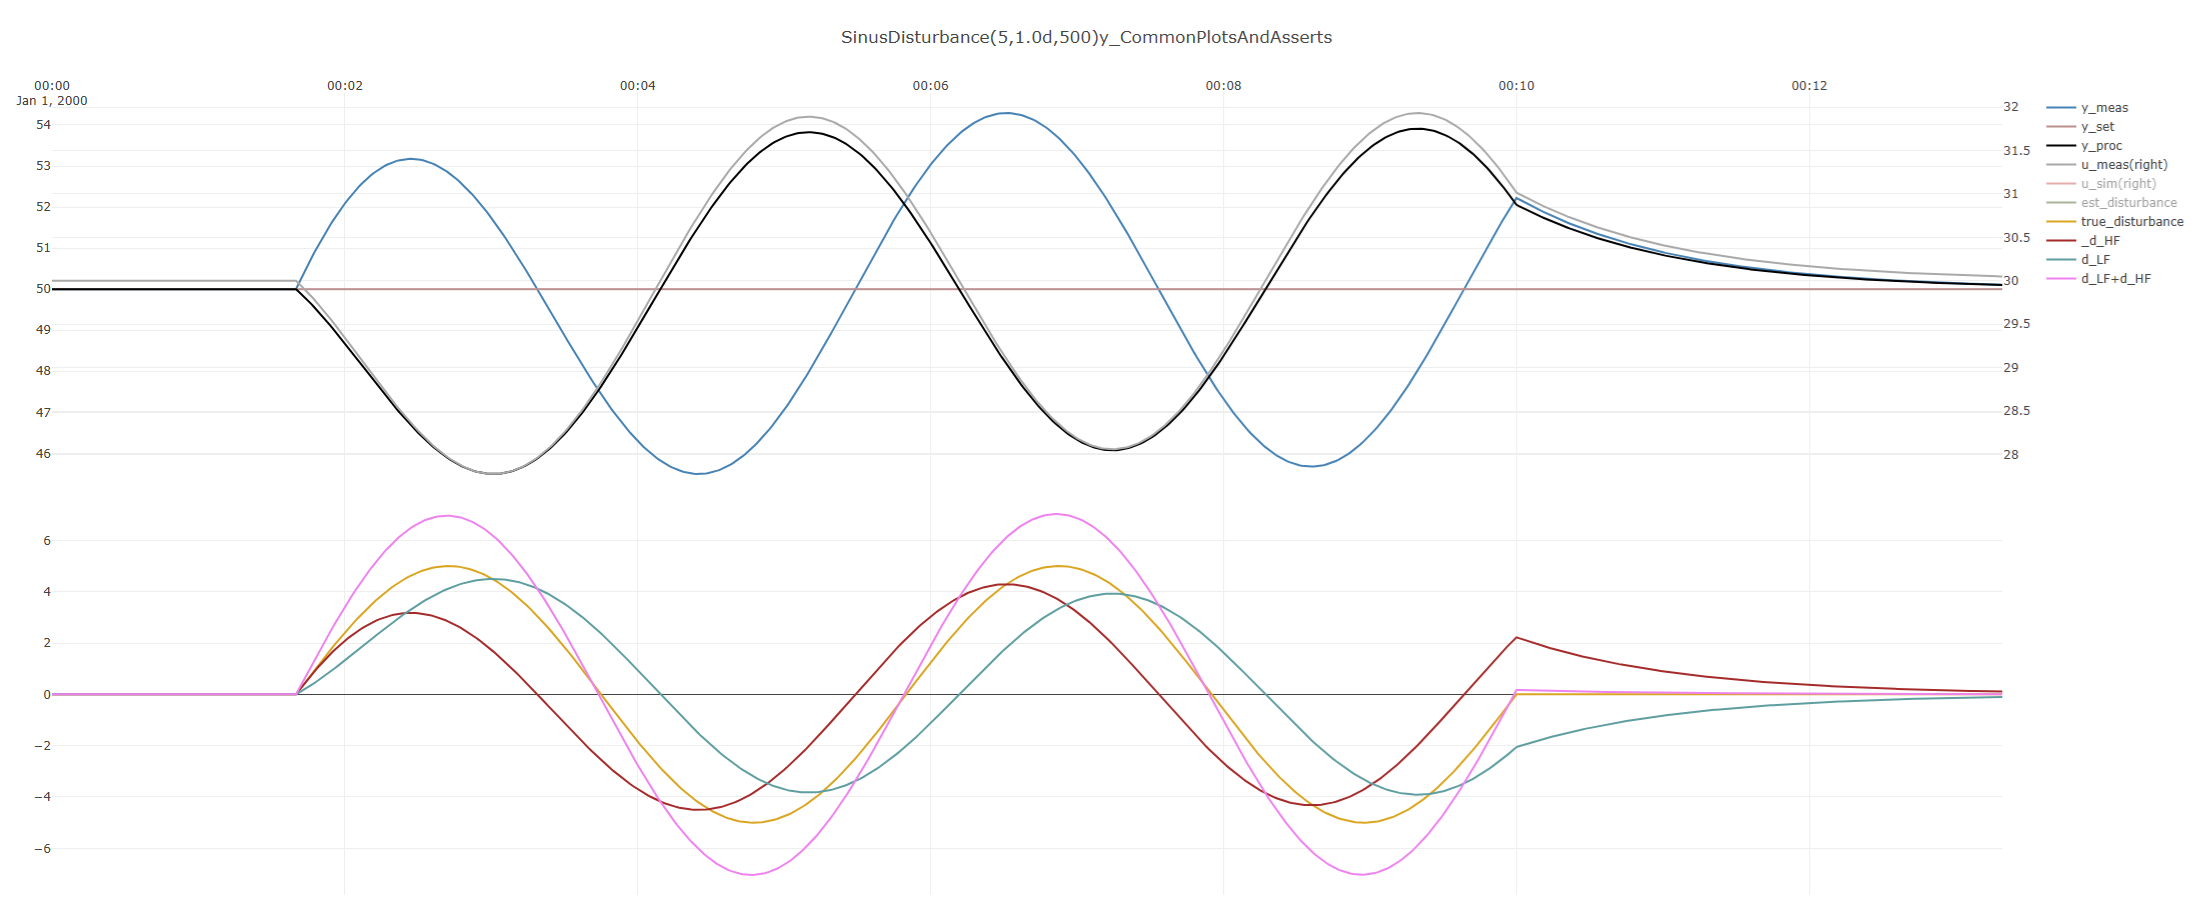
The same "sinus disturbance" example as higher in this section is revisited, and plotting \(d_{LF}\) and \(d_{HF}\), and their sum:
Discussion
- In the step disturbance case, the maximal amplitude of \(d_{LF}\) matches the amplitude of the true disturbance. This example illustrates how \(d_{LF}\) could for some disturbance provide hints on the magnitude of the process gain. So that \(\max_t d_{LF}(t) \approx \max_t d_{HF}(t)\)
- In the sinus disturbance case, it is far less obvious how to exploit these terms to aid in the selection of process model and disturbance estimate:
- \(d_{LF}\) and \(d_ {HF}\) and the true disturbance \(d\) are all phase-shifted from one another
- the \(\max_t d_{LF}(t) \neq \max_t d_{HF}(t)\)
Alternative \(d_{LF}/d_{HF}\) algorithm
The below method is under evaluation and included in latest builds on a trial basis
- if
Pass1of theminQbased algorithm above fail to yield a solution: - Repeat for a number of passes similar to the
minQalgorithms aboveStep1: attempt to find a gain \(G\) so that the difference between \(d_{HF}\) and \(d_{LF}\) is minimized, holding \(T_c\) constantStep2: attempt to find a time-constant \(T_c\) so that the difference between \(d_{HF}\) and \(d_{LF}\) is minimized, holding gain \(G\) constant
This method has been tested as a stand-in for the minQ method above in those cases where the step1 of that algorithm is unable t
determine any gain that corresponds to a local minimum of \(Q\)
The observation in unit-test where the solution is known is that the step2 of the method does appear to give promising estimates of the time-constant in
exactly those unit tests that are challenging for minQ method, such as when disturbances are random walks or sinuses. The step2 method appears to work
better the better estimates of gains that it receives, and in that regard the challenge is that the step1 algorithm in the \(d_{LF}/d_{HF}\) does not appear to be
reliable.
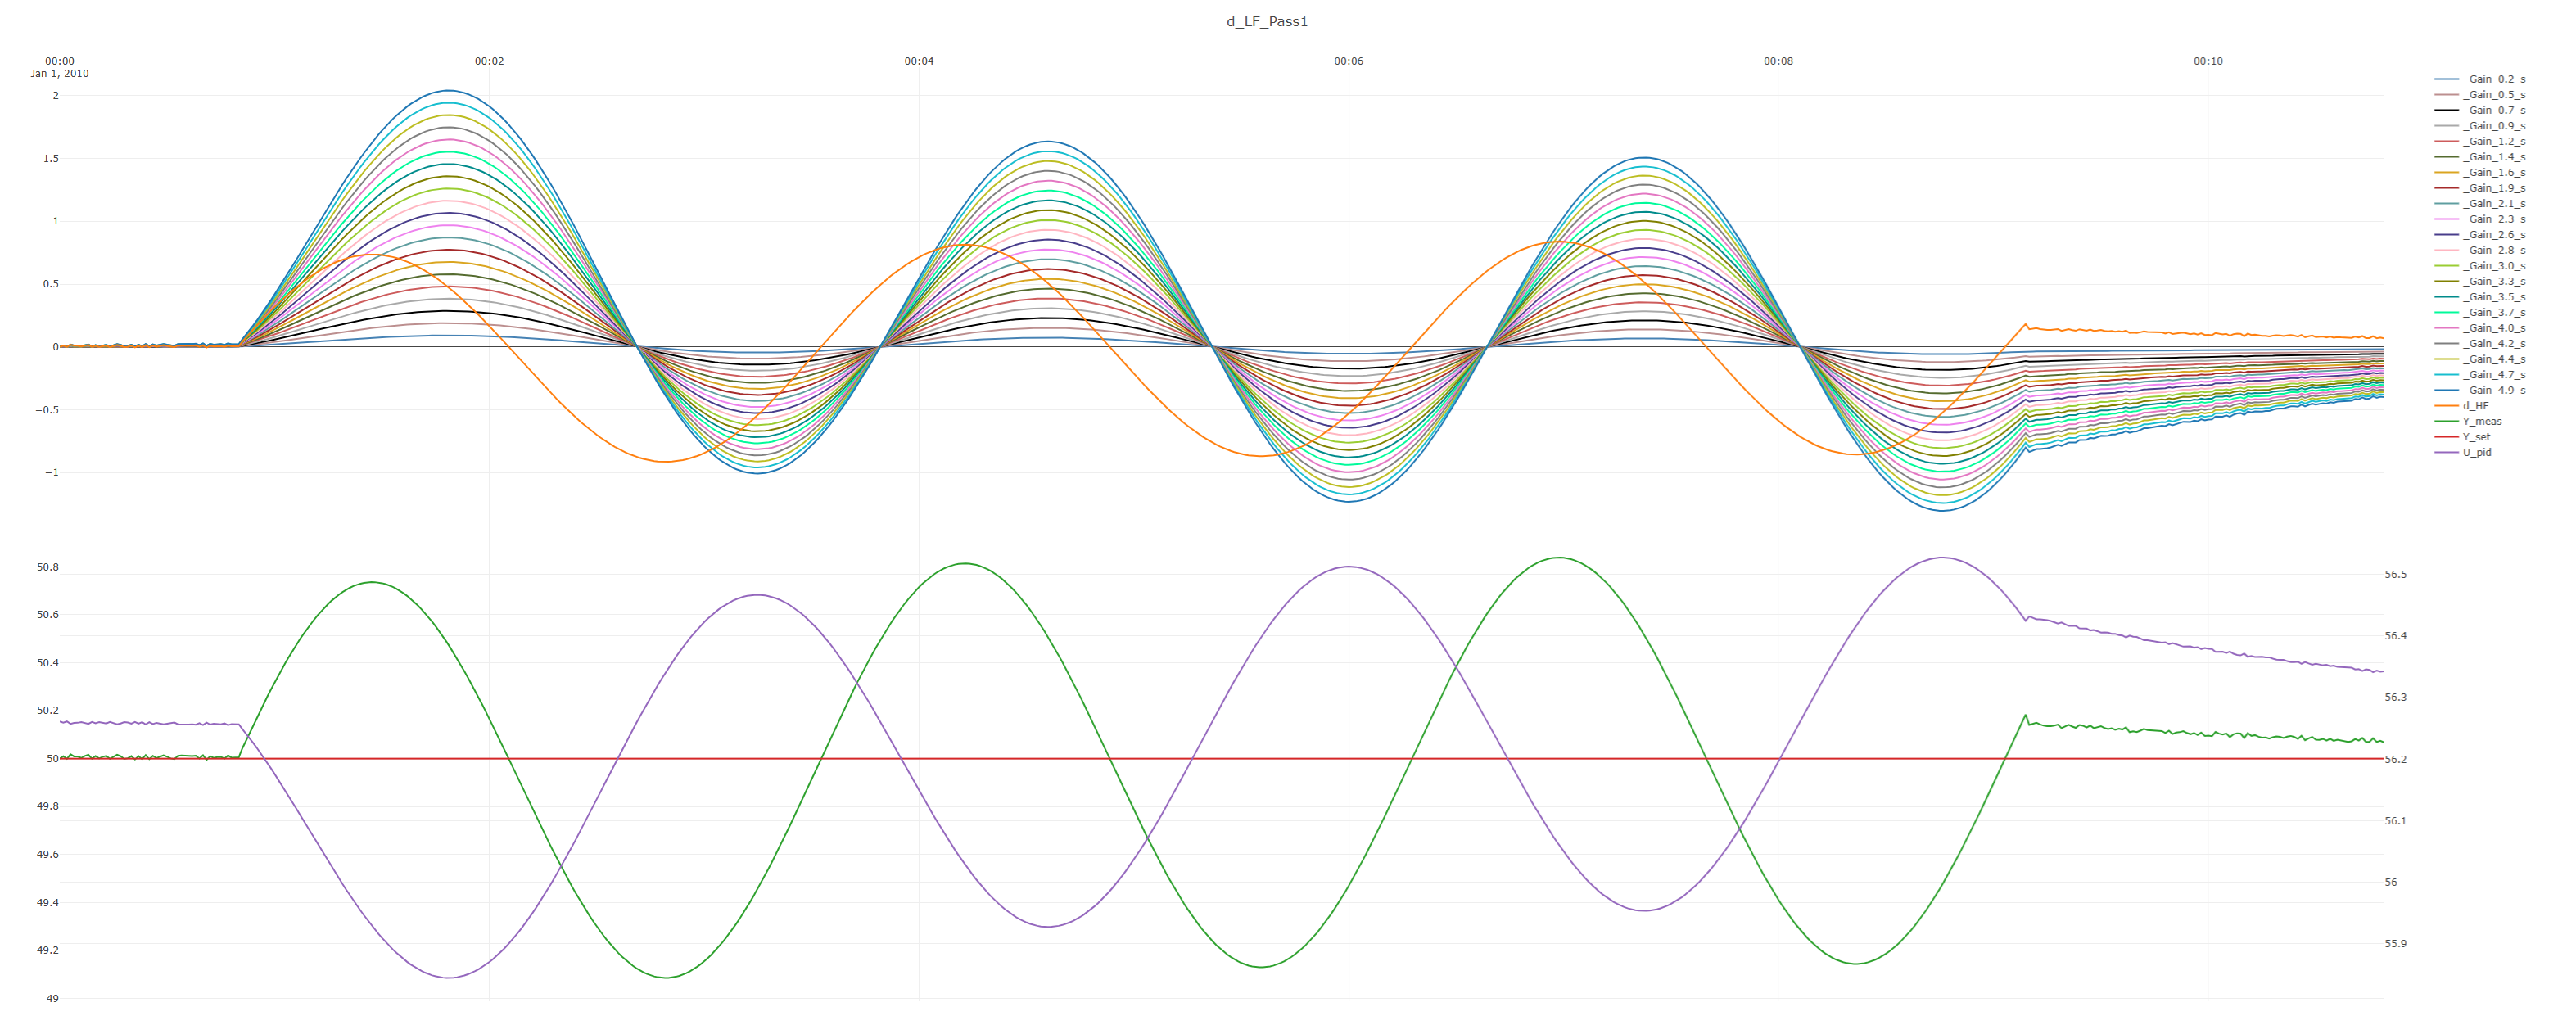
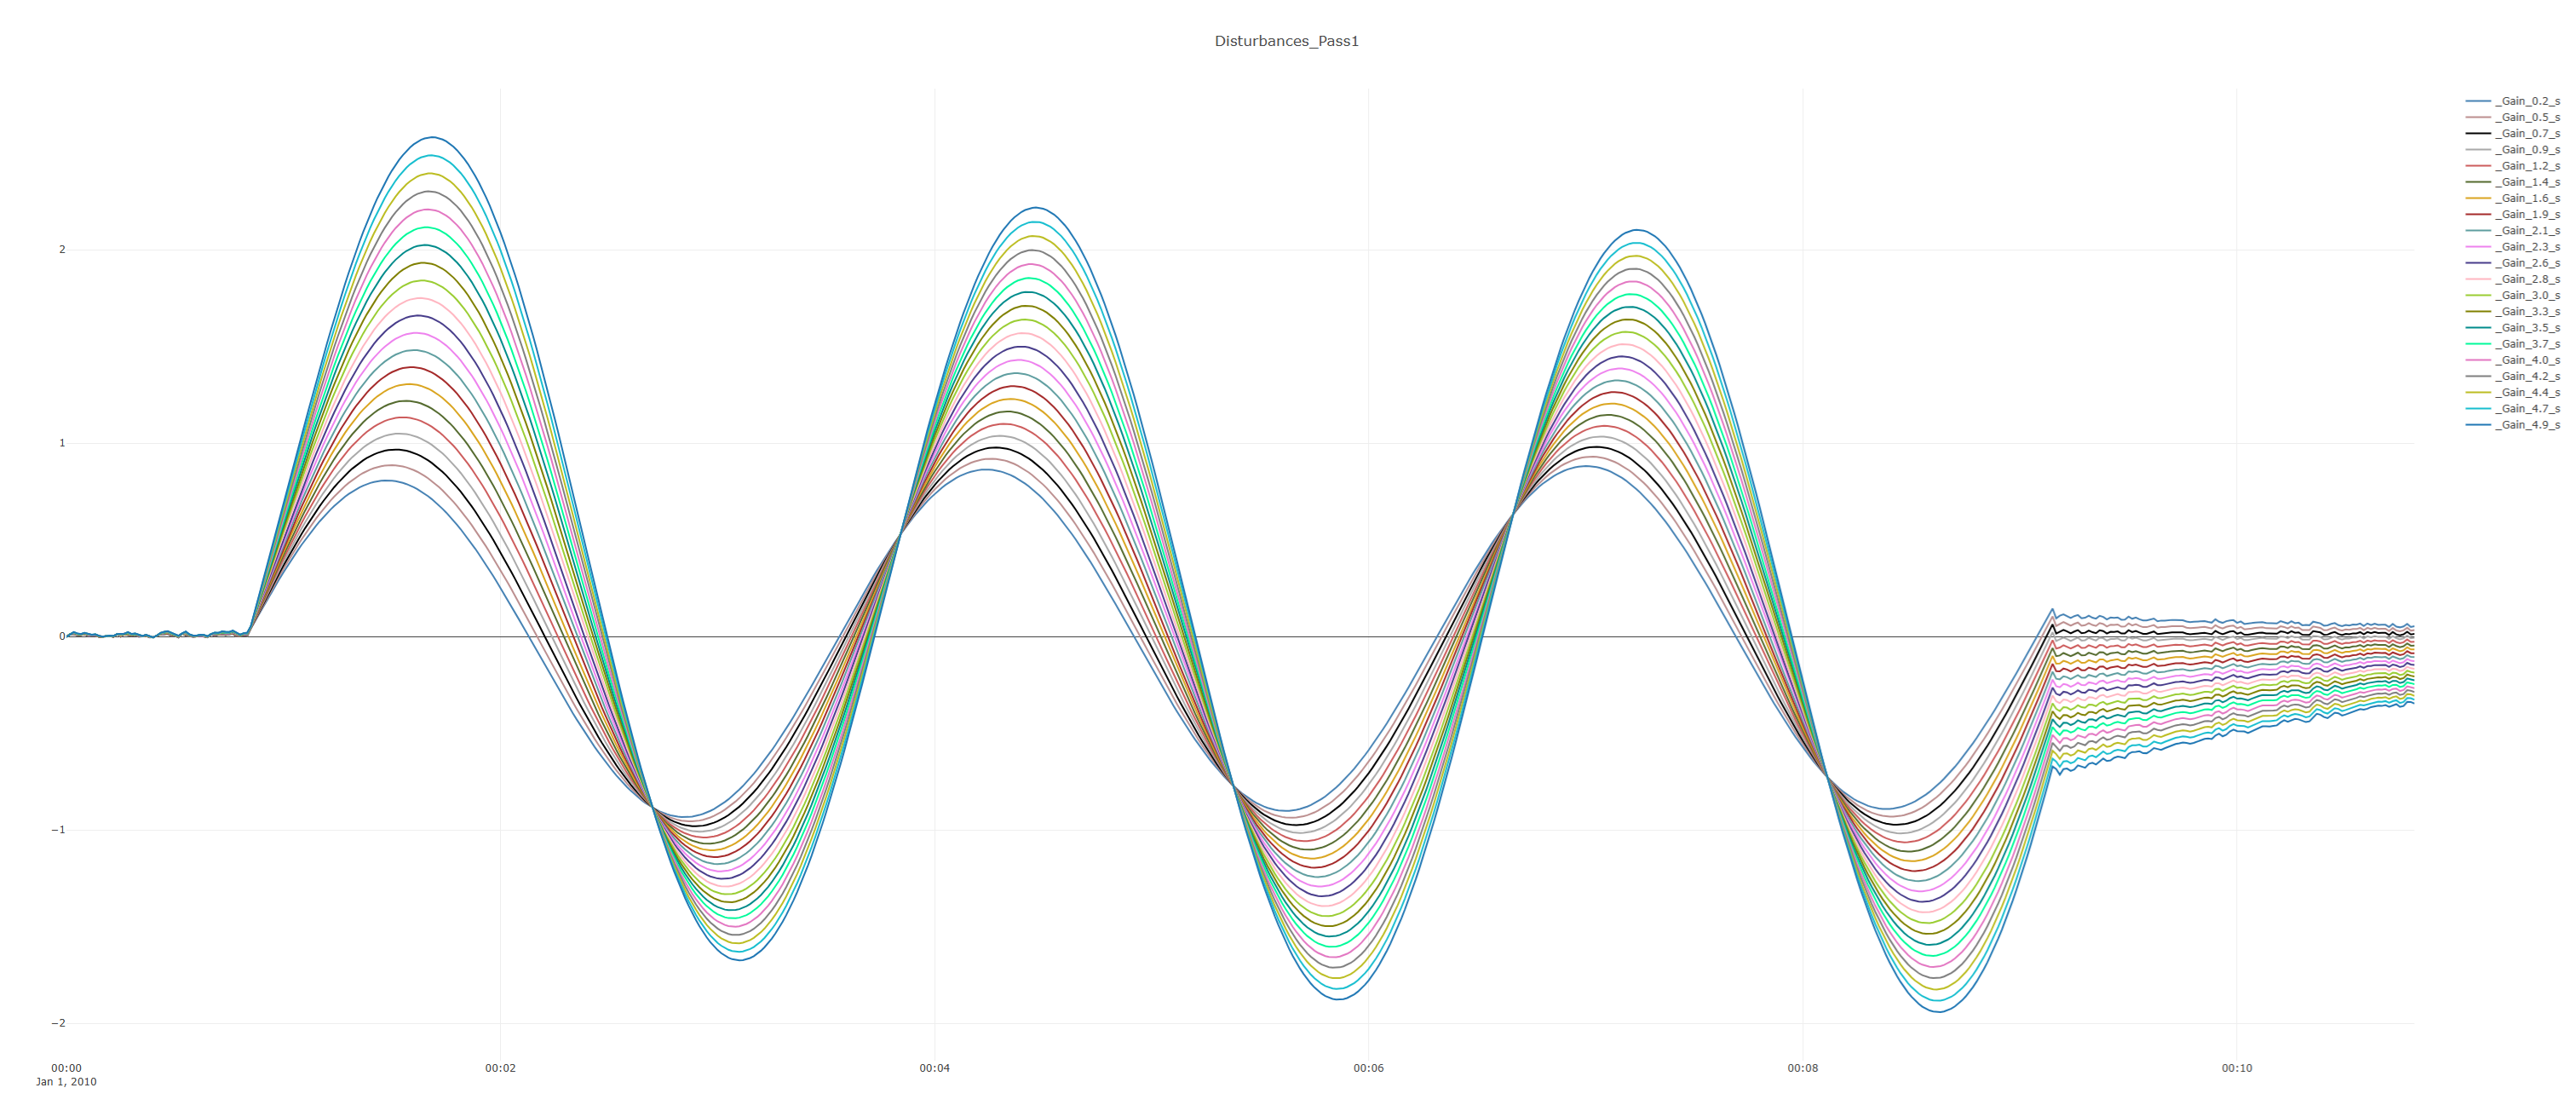
Consider the unit test SinusDisturbance(0.8d,10)(static, \(G=0.8\))
the below screenshots show how \(d_{LF}\) varies for different gains in this alternative pass1 and how the resulting \(d_{est} = d_{HF} + d_{LF}\) looks.
Observations:
- All of these \(d_{LF}\) choices for different process gain result in the same \(y_{meas}\) and the same \(u_{pid}\).
- All disturbances seem to go through points of concurrency (points where all potential disturbances lines for a given time constant meet.)
- The amplitude of the \(d_{est}\) changes for different gains, but so does the phase.
- It should be obvious that selecting lines based on \(Q(d_{est})\) would be pointless, as higher gains always result in lower cumulative absolute distance traveled.
Basically the bottom image is a parametrization of the solution space for \(d_{est}\) in terms of process gain. The image shows how the process gain is the most significant parameter describing the disturbance signal, for a given dataset with a known control deviation \(e(t)\). The candidate disturbances are roughly speaking similar in appearance, but they are scaled and phase-shifted versions of each other.
If some additional piece of information could be used to determine describe the phase or amplitude of the disturbance, even just for a brief time window, then this would allow choosing the most appropriate process gain.