Examples
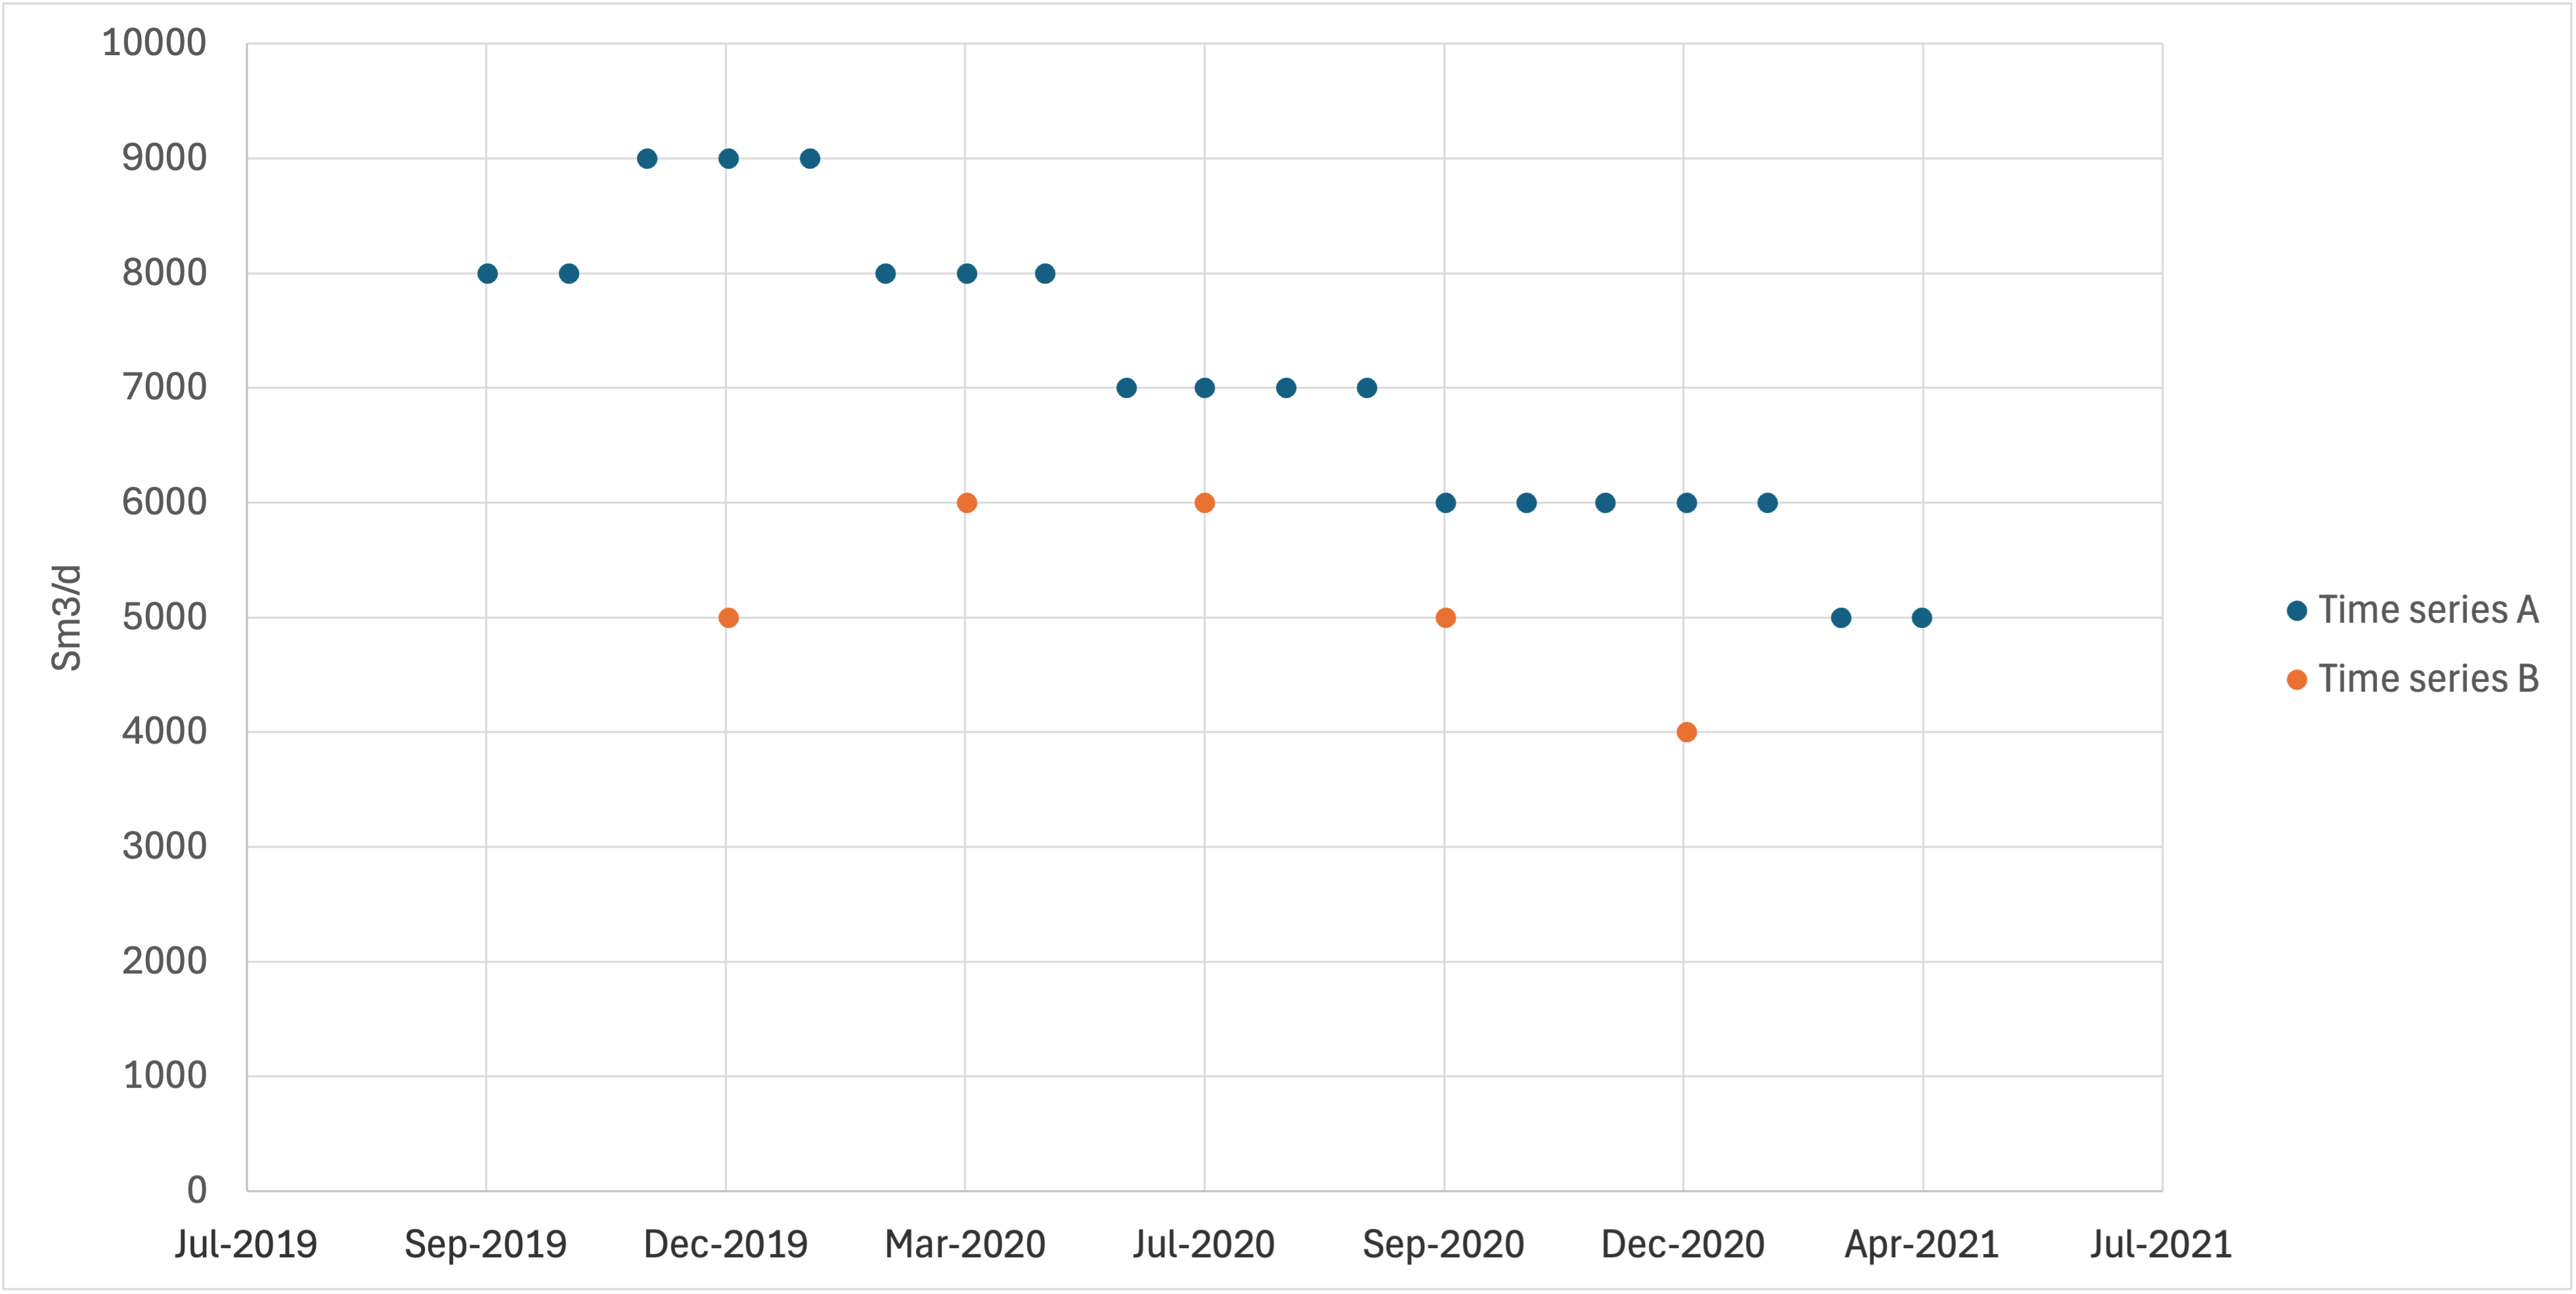
The following is an example which has two time series as input, in two different csv files. with different dates. One time series has quarterly input, the other has monthly input over a slightly longer period of time. The csv files and a figure showing the data is shown below:
Dates,                  Time_series_A
#,                      Sm3/d
2019-10-01 00:00:00,    8000
2019-11-01 00:00:00,    8000
2019-12-01 00:00:00,    9000
2020-01-01 00:00:00,    9000
2020-02-01 00:00:00,    9000
2020-03-01 00:00:00,    8000
2020-04-01 00:00:00,    8000
2020-05-01 00:00:00,    8000
2020-06-01 00:00:00,    7000
2020-07-01 00:00:00,    7000
2020-08-01 00:00:00,    7000
2020-09-01 00:00:00,    7000
2020-10-01 00:00:00,    6000
2020-11-01 00:00:00,    6000
2020-12-01 00:00:00,    6000
2021-01-01 00:00:00,    6000
2021-02-01 00:00:00,    6000
2021-03-01 00:00:00,    5000
2021-04-01 00:00:00,    5000
Dates,                  Time_series_B
#,                      Sm3/d
2020-01-01 00:00:00,    9000
2020-04-01 00:00:00,    8000
2020-07-01 00:00:00,    7000
2020-10-01 00:00:00,    6000
2021-01-01 00:00:00,    6000
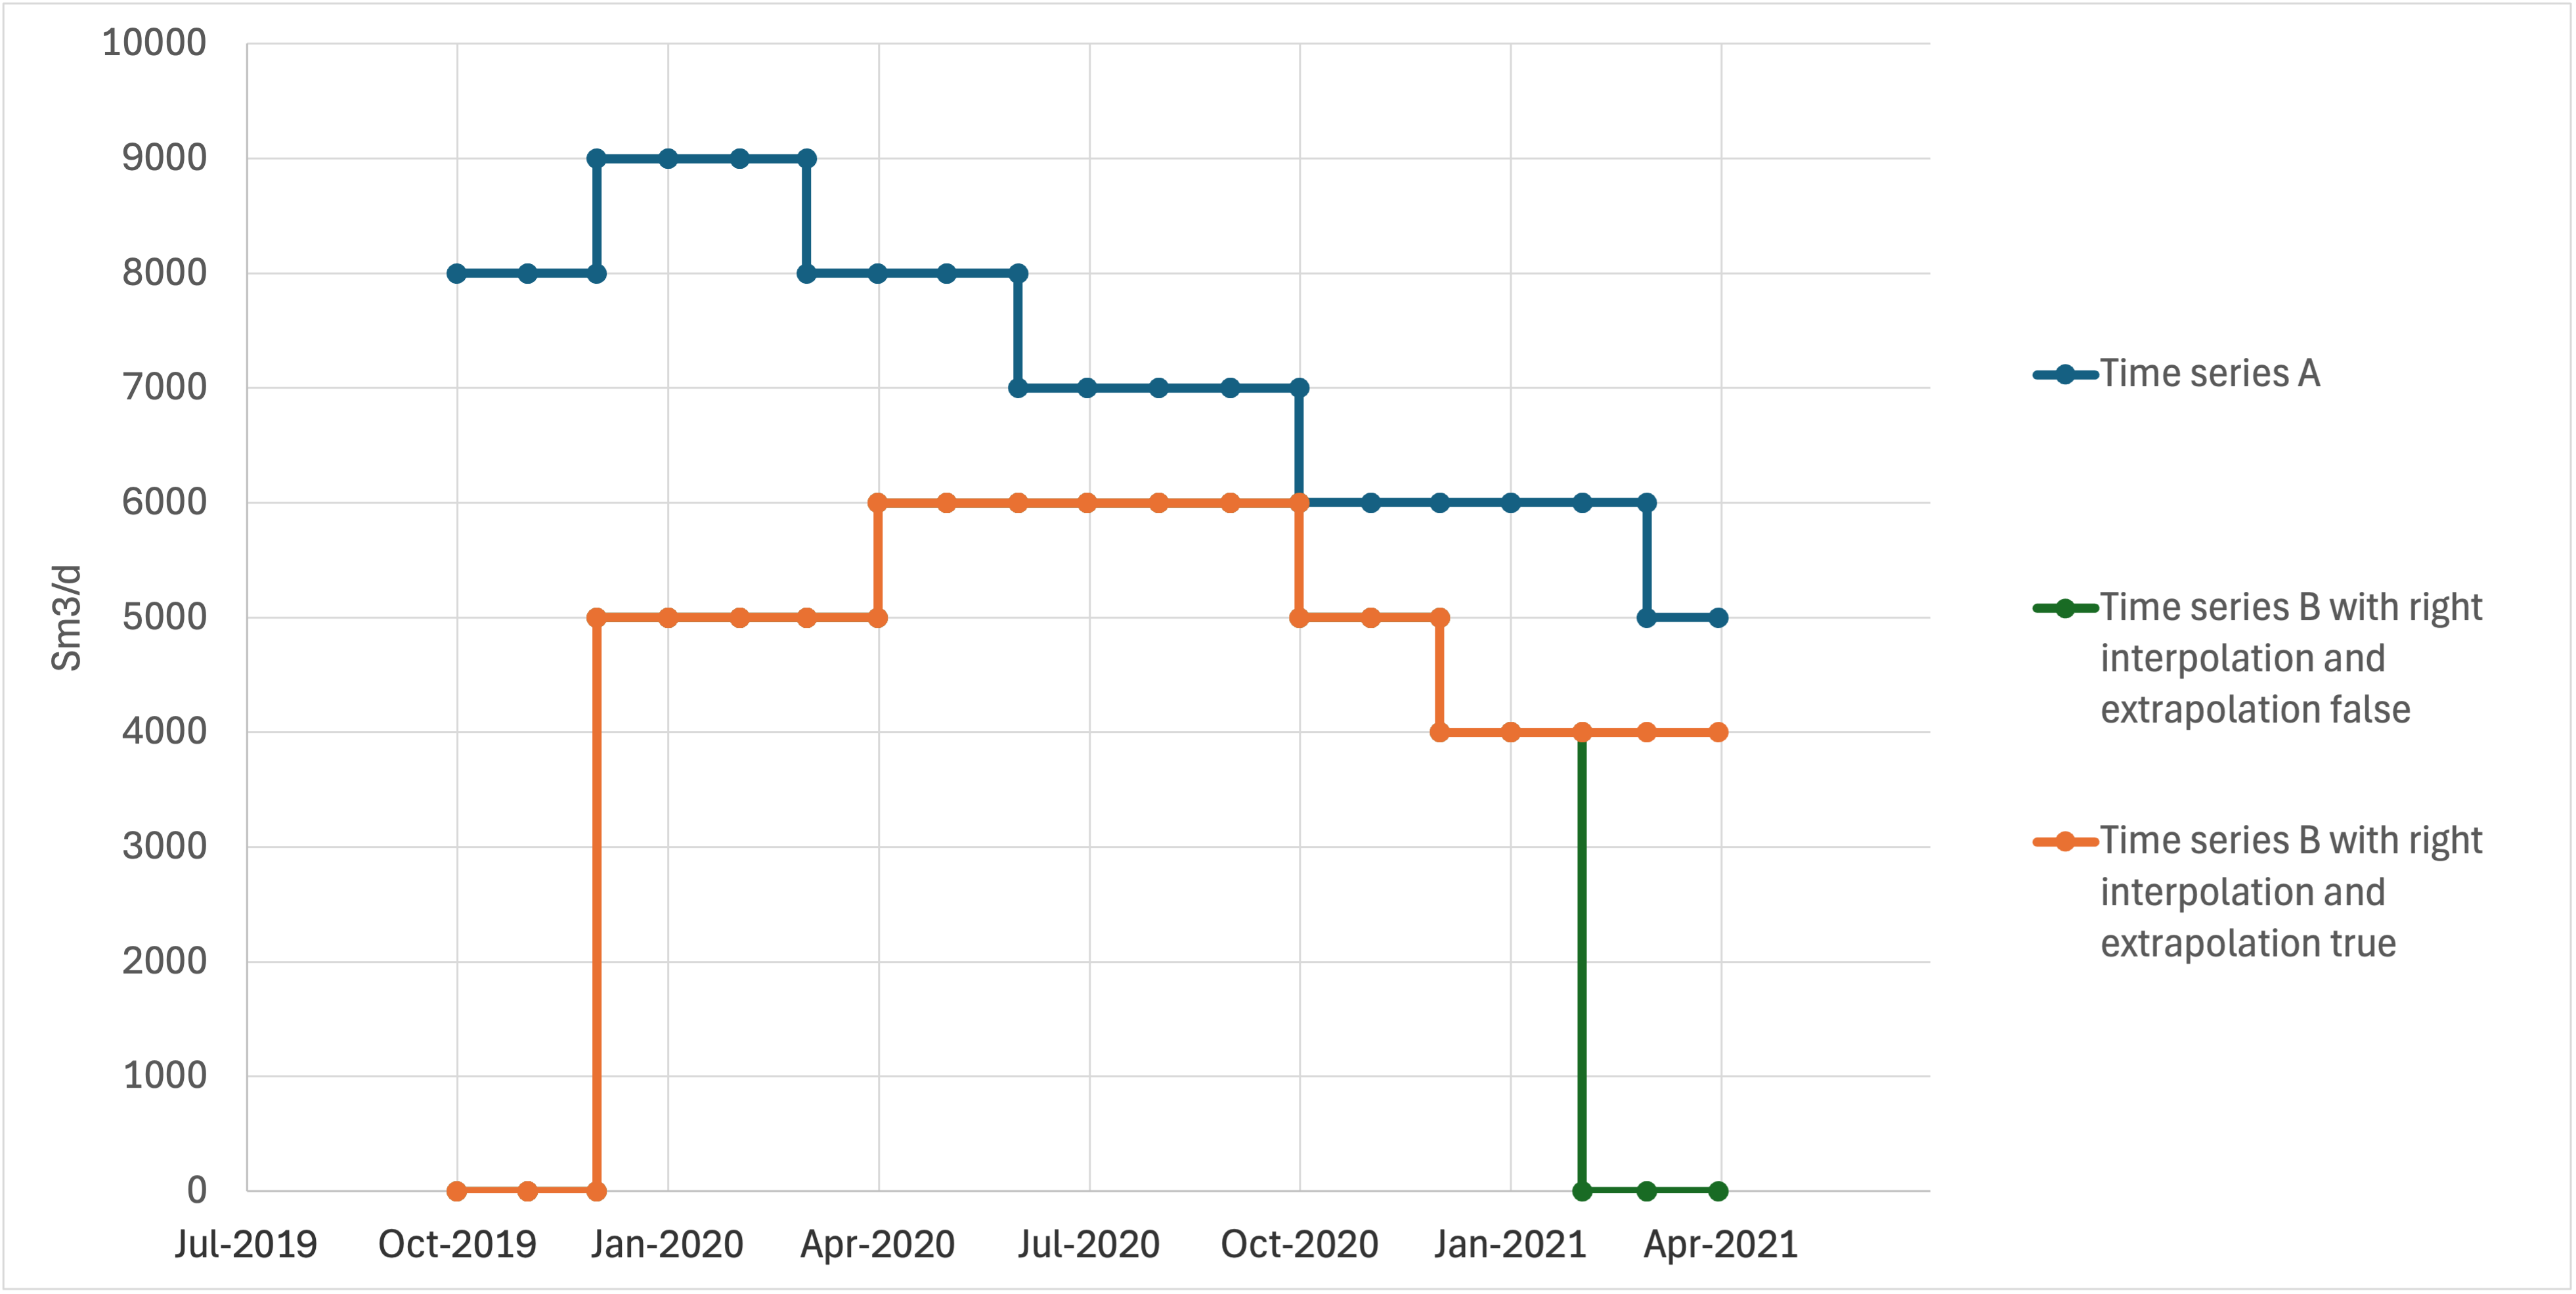
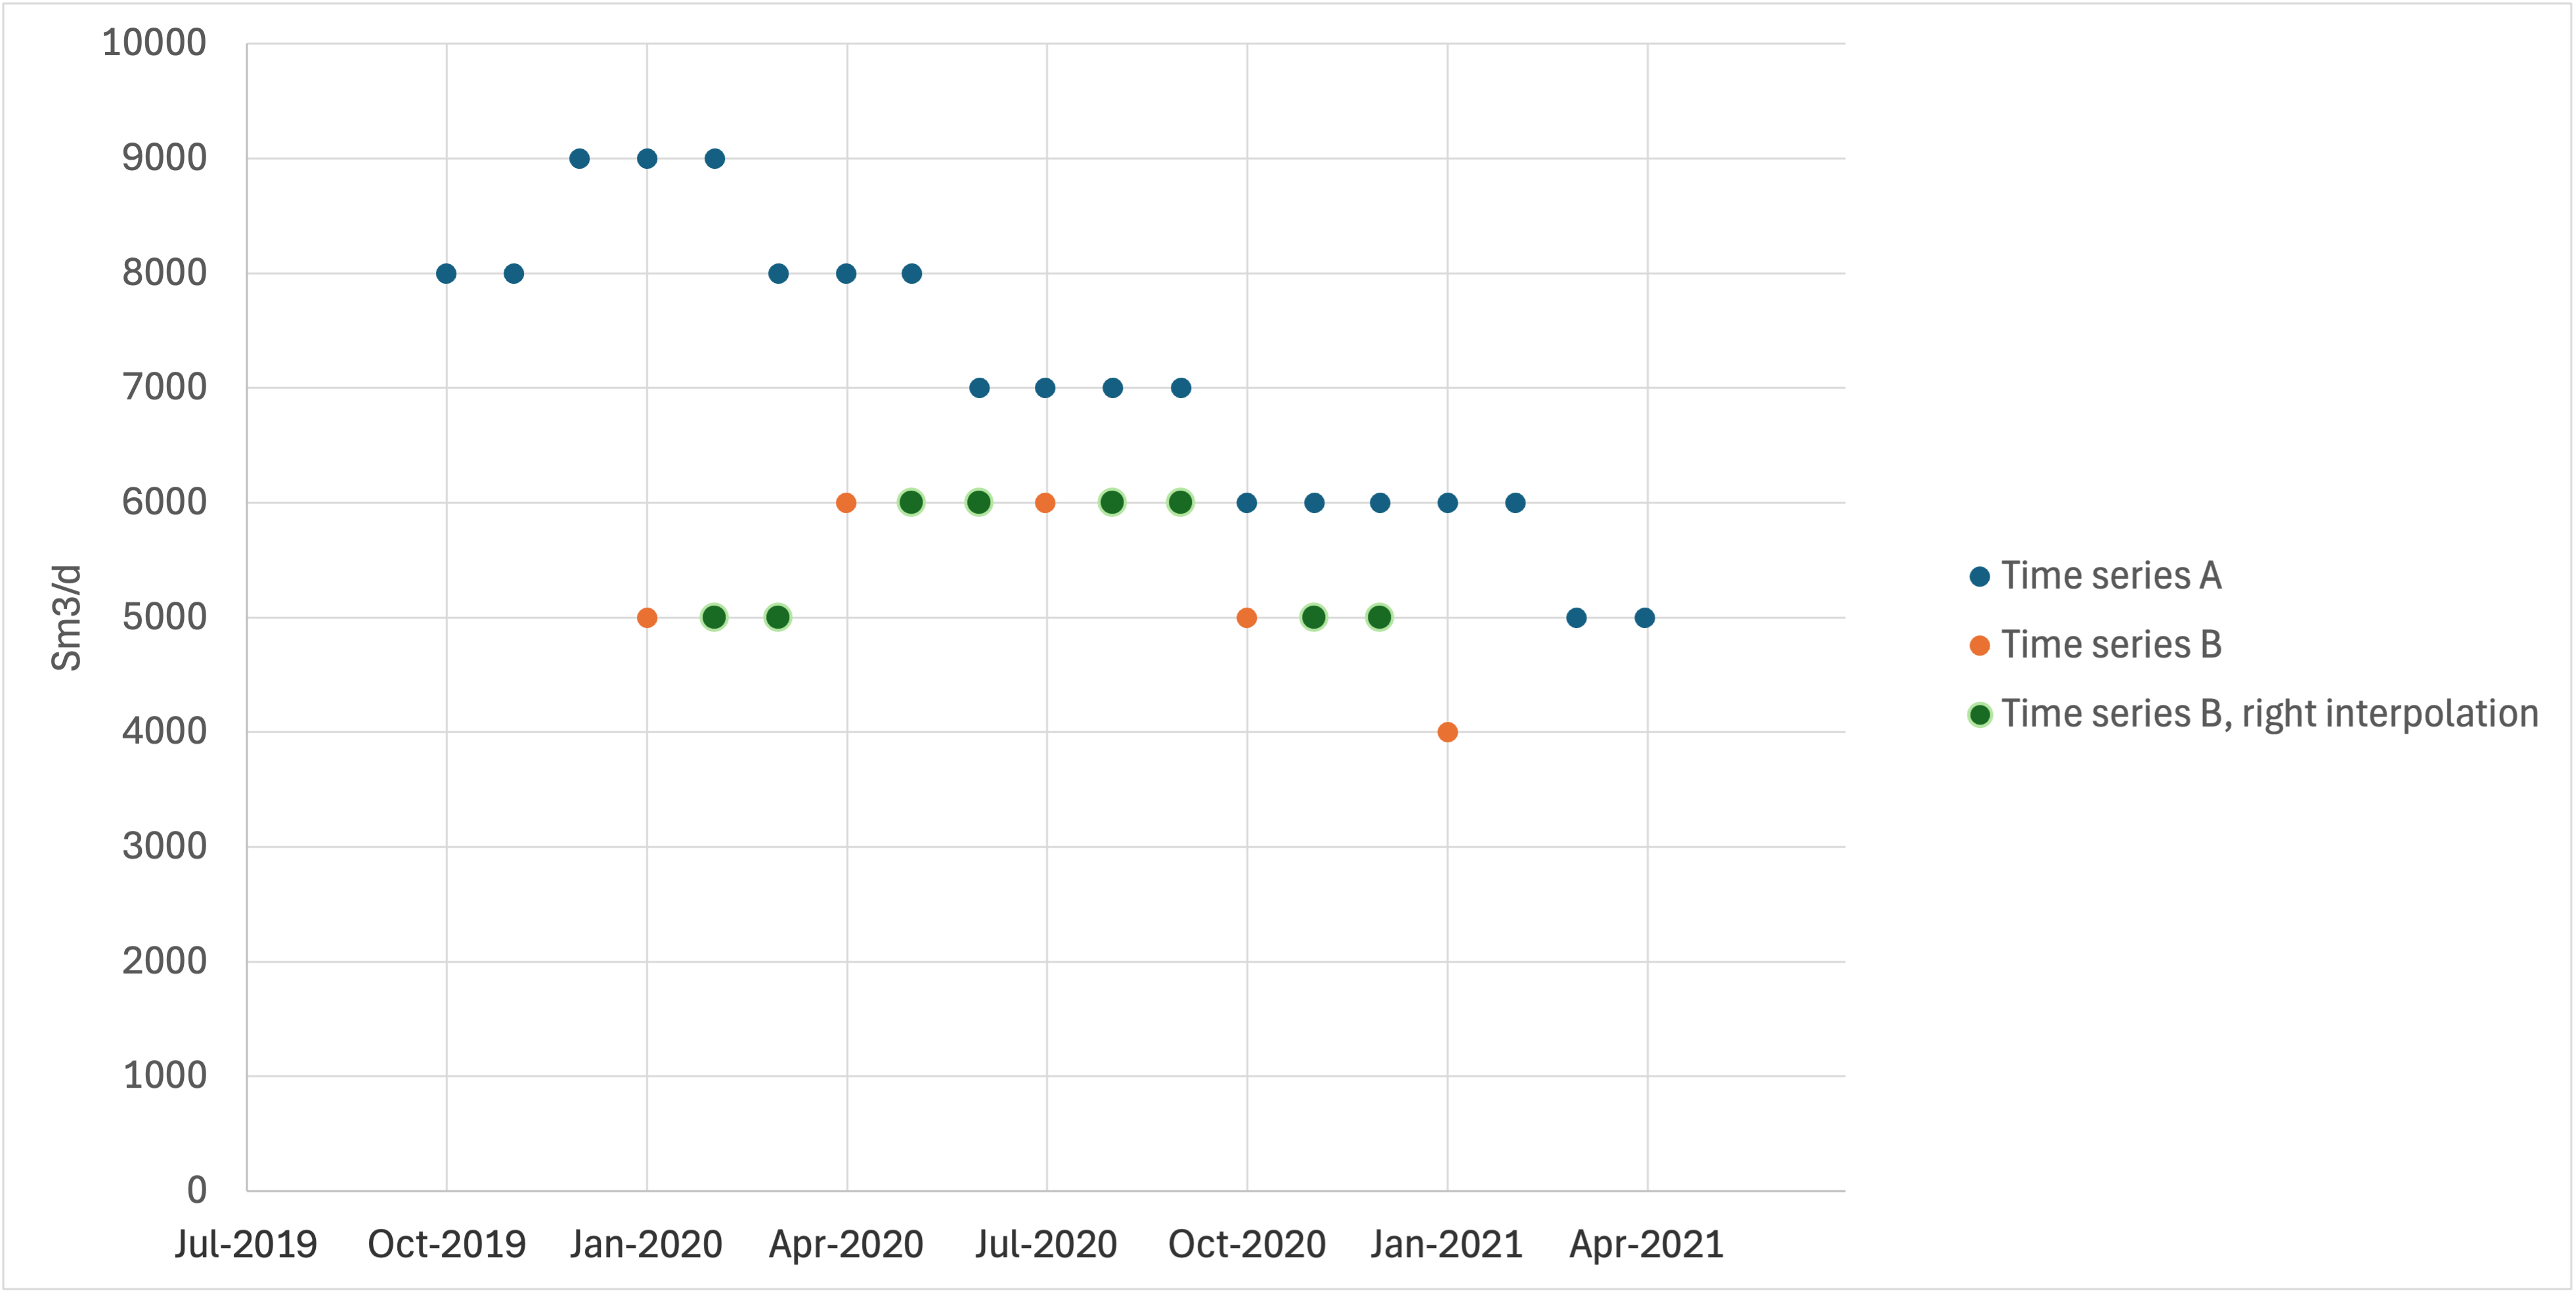
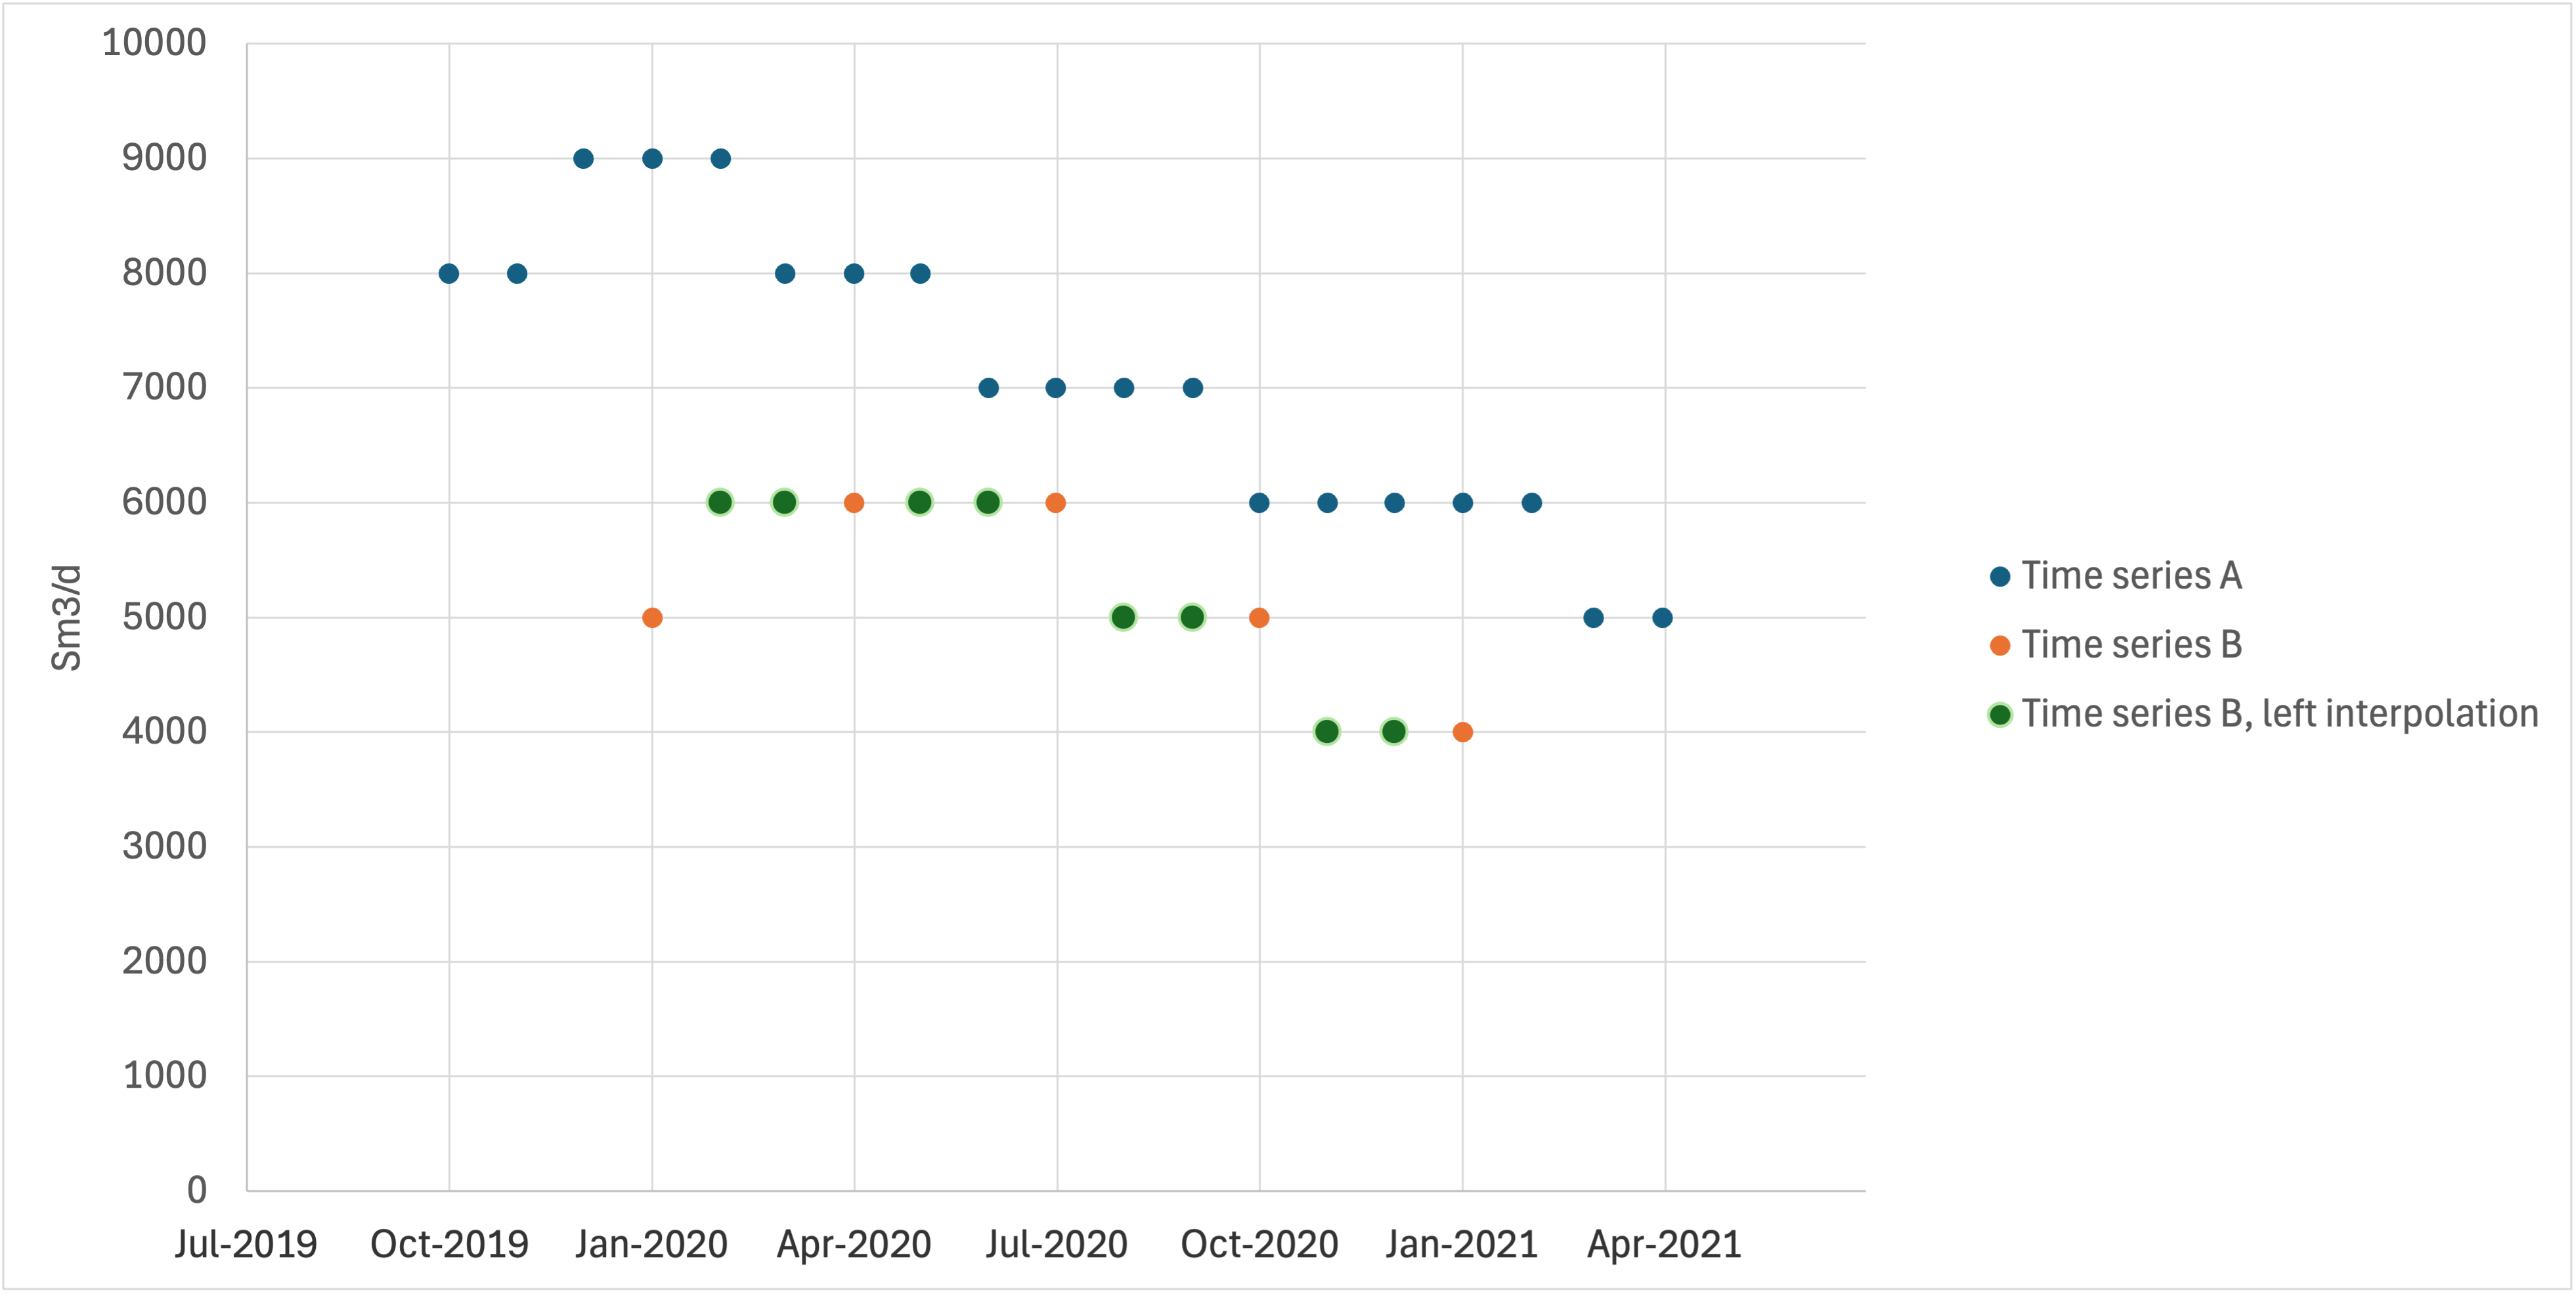
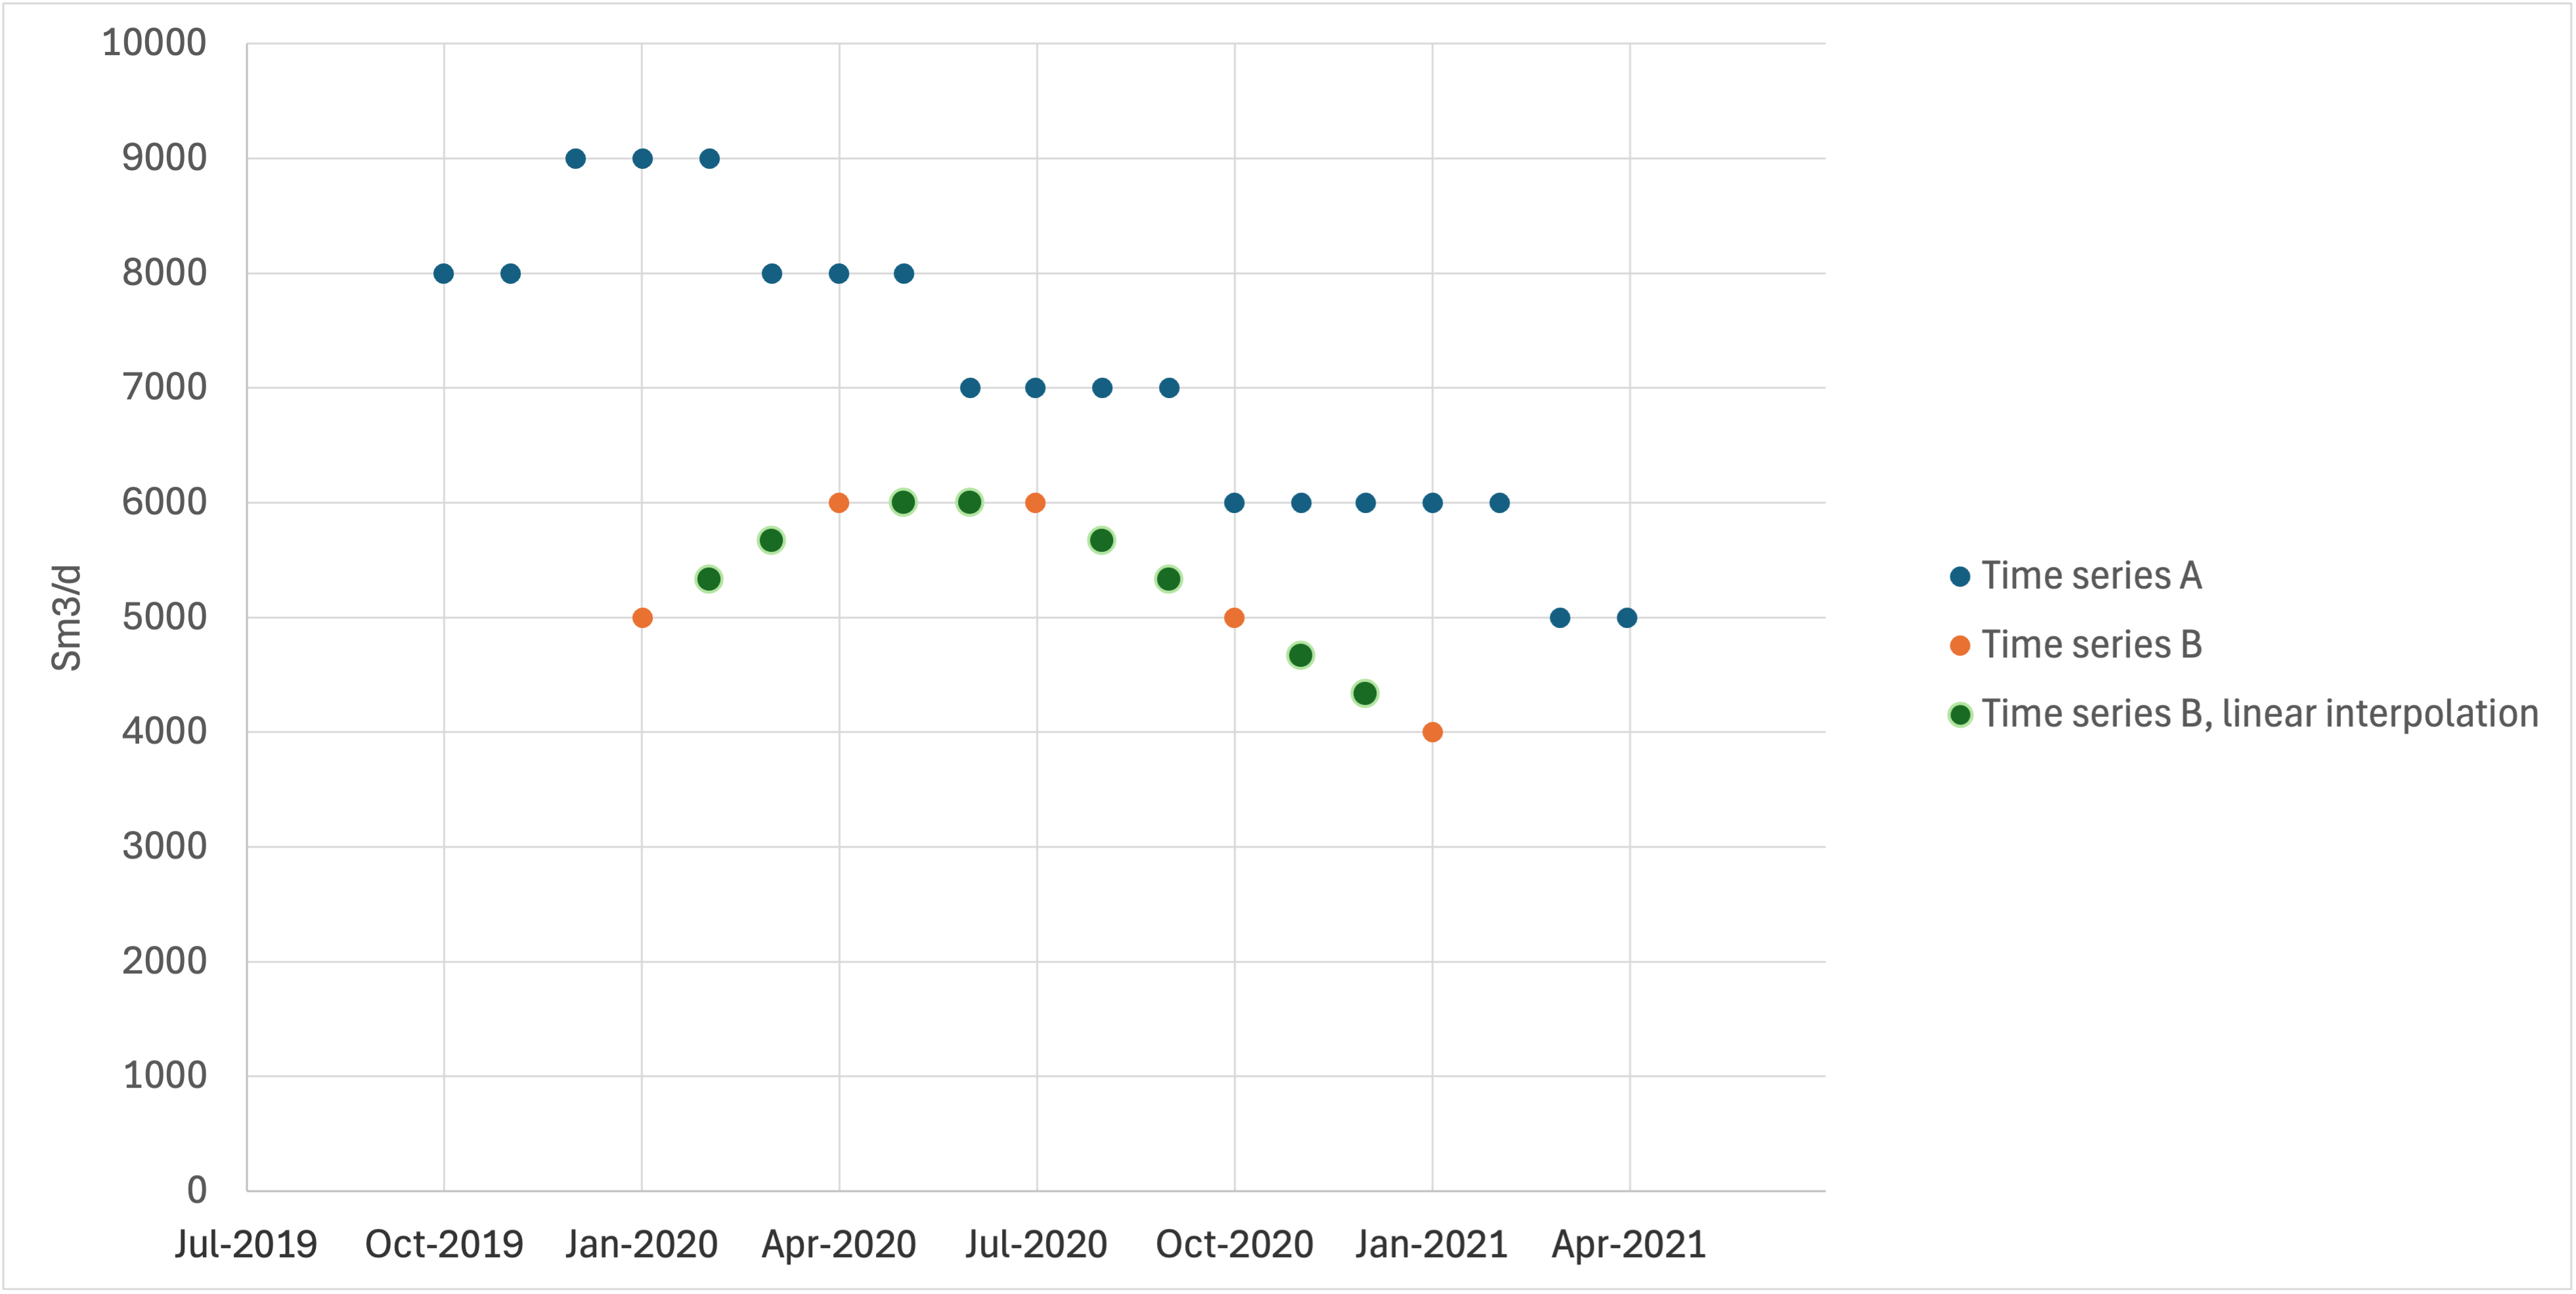
In this case there is no information about the global start and end dates in the YAML model file. Then eCalc™ needs to extract this information from the time series csv files. In this case the start will be 01/09/2019 and the end will be 01/04/2021. Time series B also needs values for all the dates where time series A has values. Between dates where time series B already has values, this will be done through interpolation. The type of interpolation used is determined by the INTERPOLATION_TYPE.
Dates that are prior to or after the existing dates, will be filled using extrapolation.
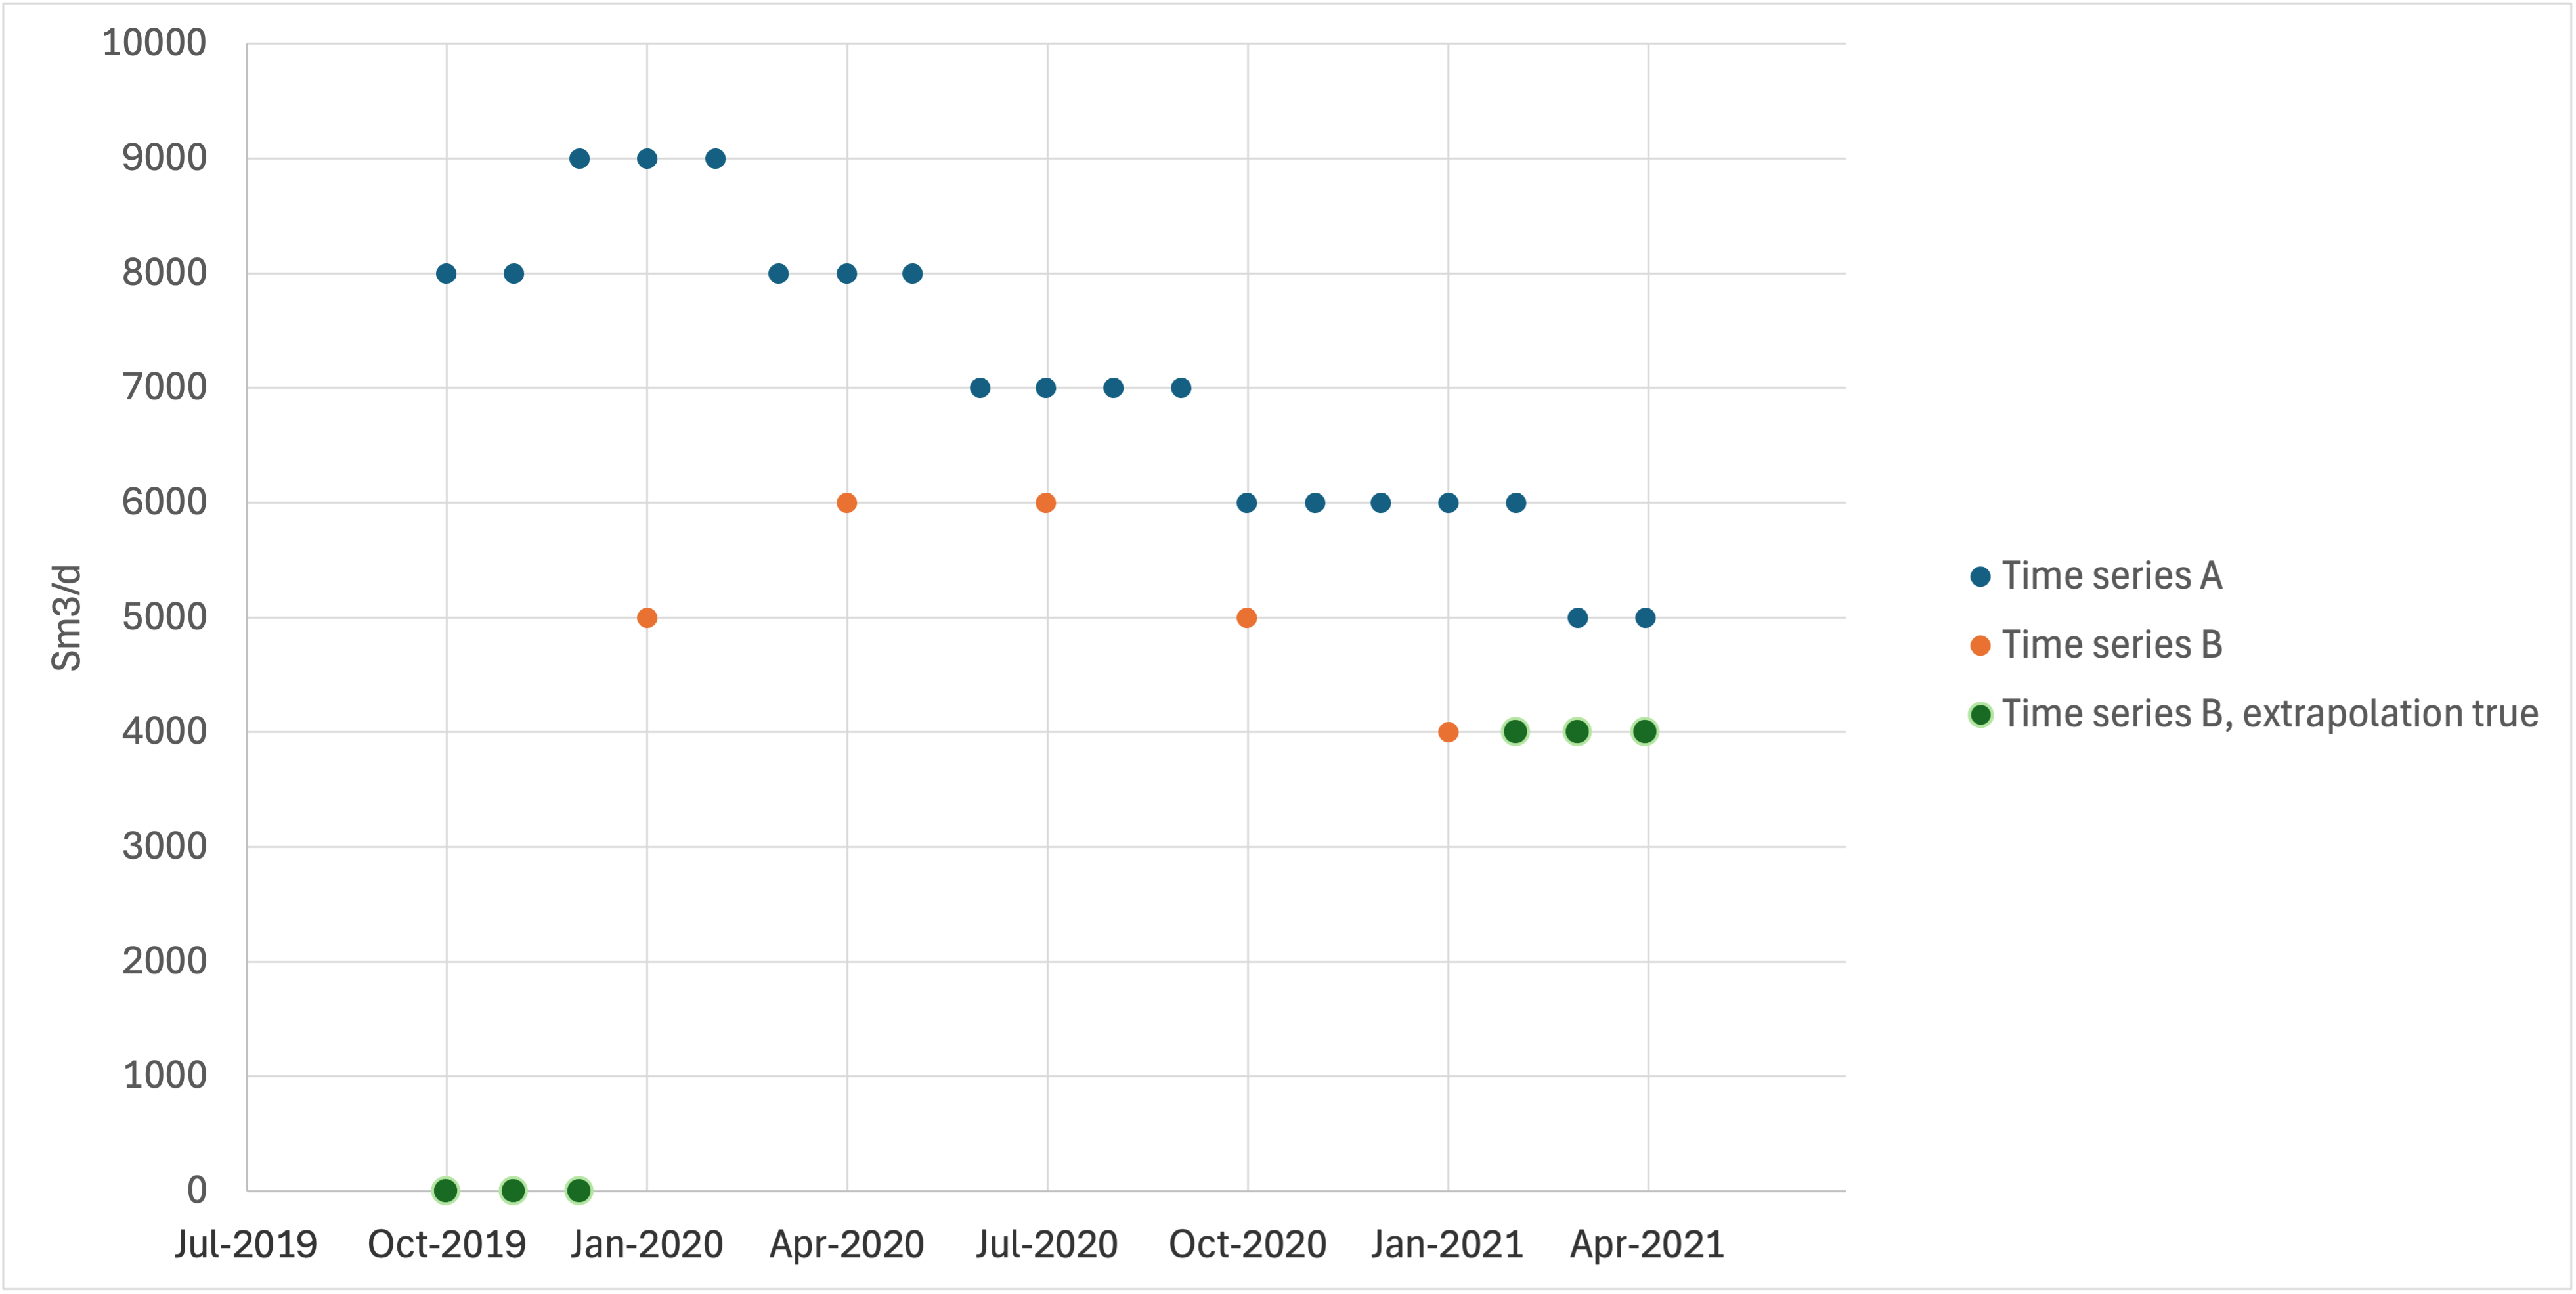
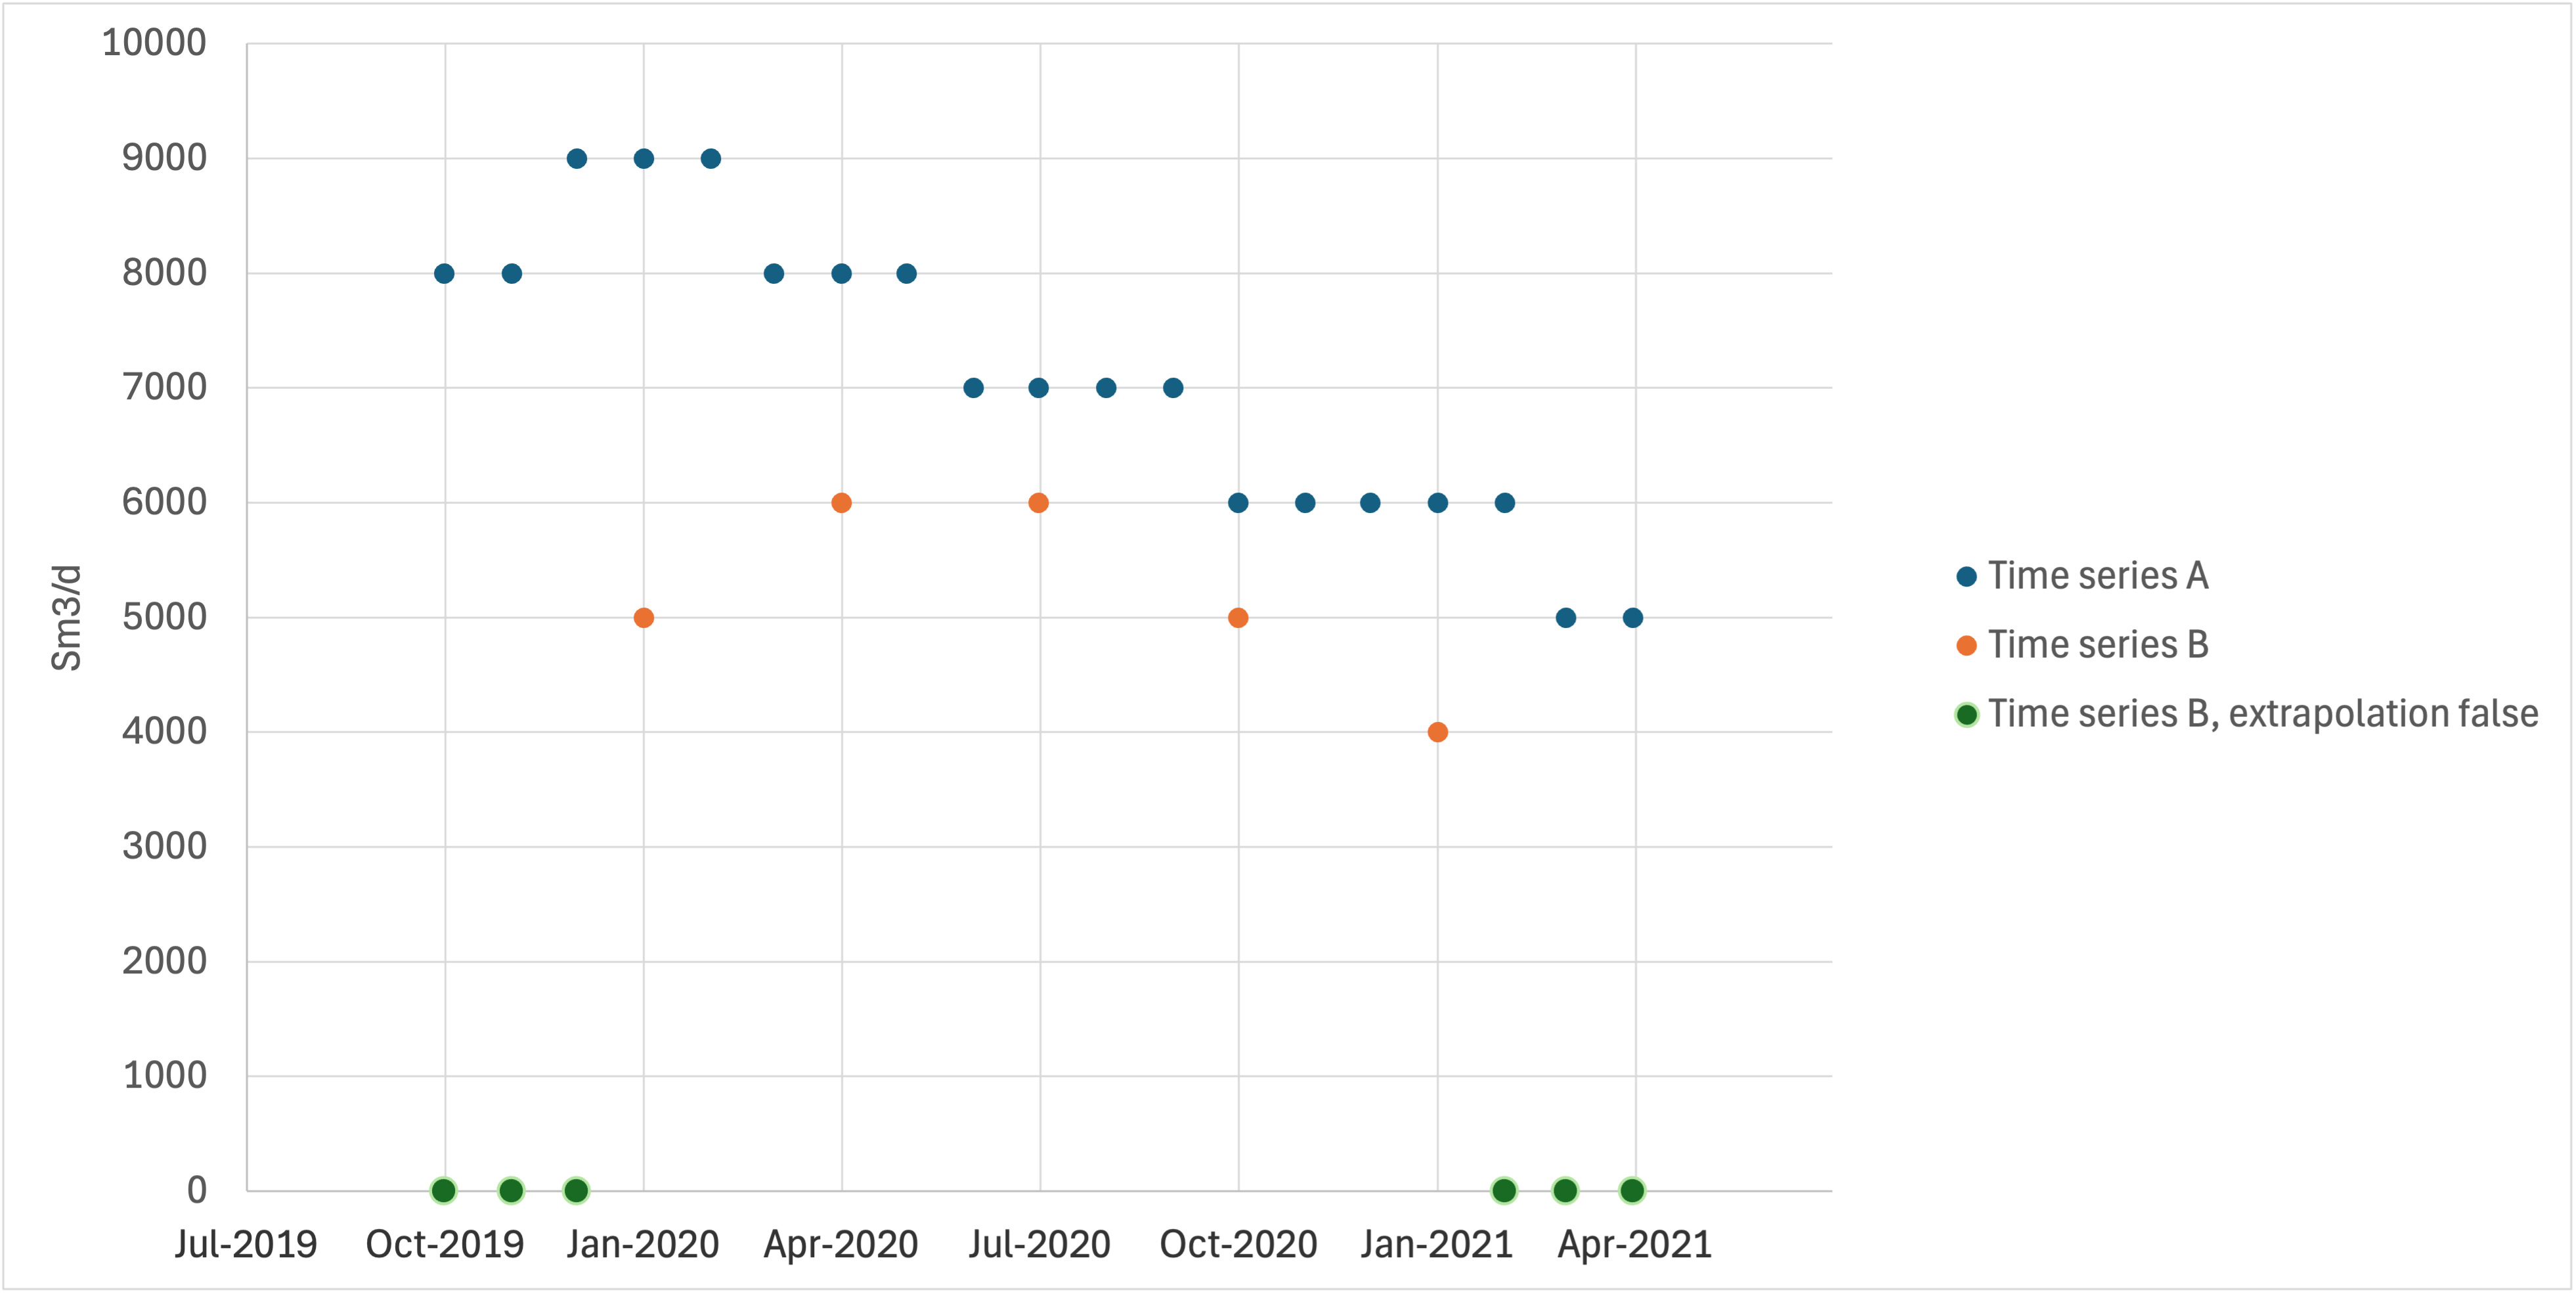
Notice that the last value given in time series B will be used for the period starting at the last date in the original time series B, even when extrapolation is set to false
Calculations within eCalc™ will only happen at the dates in the input time series. Within a period between two input
dates, the values are assumed to be constant, as shown in this plot.