rft
rft will convert the binary RFT files to dataframes or CSV files, facilitating analysis of inflow and pressure for each connection the well has to the reservoir grid.
Typical usage is to generate the CSV from the command line:
res2csv rft MYDATADECK.DATA --verbose --output rft.csv
It is possible to a specific well, a date (YYYY-MM-DD). If you enable debug mode
through --debug, more information is printed, including an ASCII representation
of each wells topology, and also three extra CSV files printed for the last
processed well.
Eclipse usage
In order to get RFT files emitted from Eclipse, you need the WRFTPLT keyword
in your .DATA file, example:
WRFTPLT
  '*' 'REPT' 'REPT' 'REPT' /
/
where * will match all wells defined up to this point.
From RMS11, you can insert
YYYY-MM-DD IORFT NAME='*' PLTFREQ='Yes' RFTFREQ='Yes' SEGFREQ='Yes'
into your events files to obtain the same (input a date in your specified date format).
Segment and ICD analysis
For multisegment wells, reservoir connections (CONxxxxx data) are matched
to their corresponding well segment (SEGxxxxx data) and the matched data is
returned on the same row in the CSV file, facilitating cross-plot of data.
When ICD segments are detected (well segments that sit alone on their own
branch), these data are tagged with an ICD_ prefix to their SEGxxxxx
columns, and also matched to the row with the connection and segment data.
This facilitates analysis of f.ex. pressure drop from the reservoir, in the ICD,
and in the tubing.
Limitations
Each segment must correspond to no more than one reservoir connection. This is the recommended way to model multisegment wells.
Segments not related to a reservoir connection are not included in the outputted CSV file.
Analysis examples
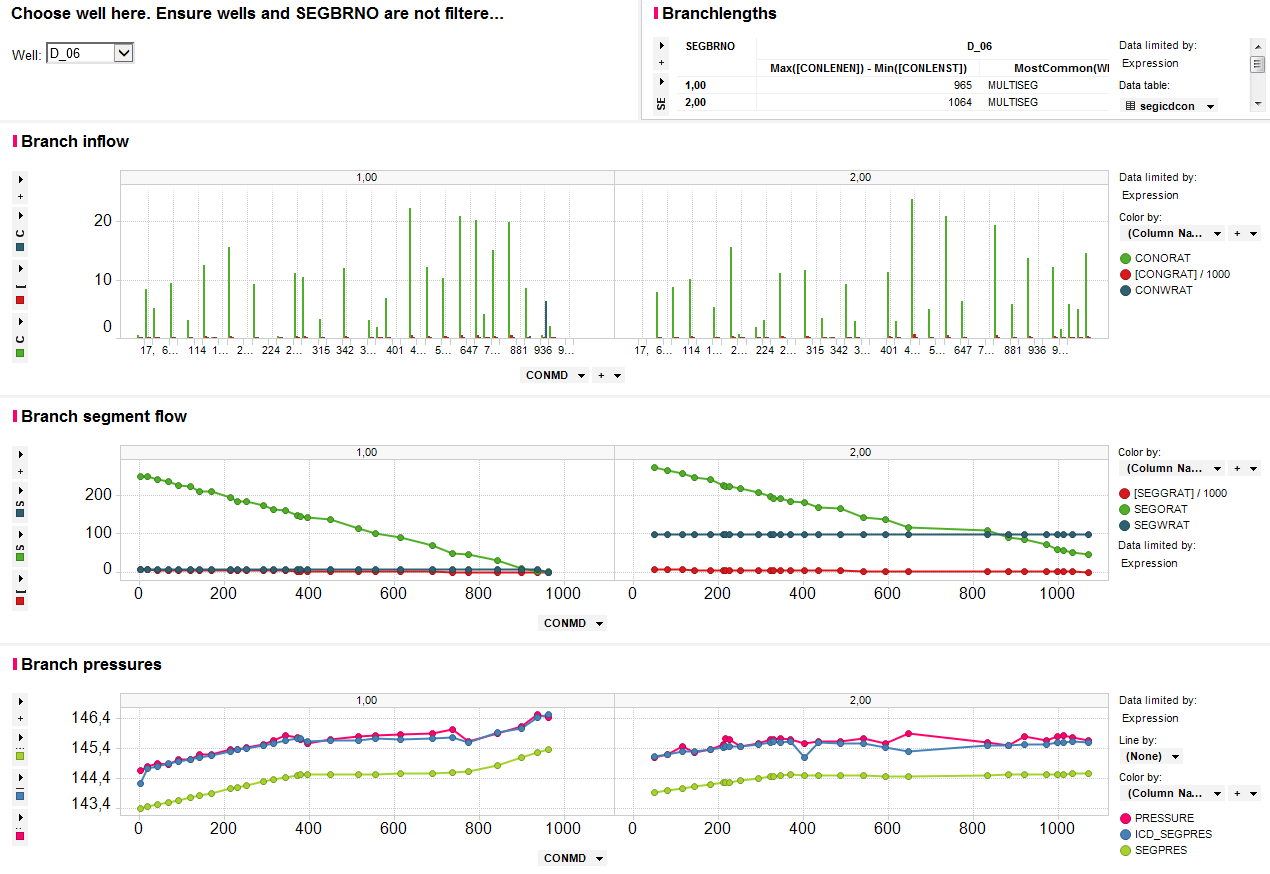
Example illustrating inflow analysis of a two-branch well in a visual tool for tabular data. From the data in the emitted CSV, branch lengths can be computed, inflow pr. phase can be plotted versus segment index or depth, or phase flow in the tubing versus the same. Pressure drop from reservoir cell to tubing can be analyzed. In this image, the data is filtered to a specific date.

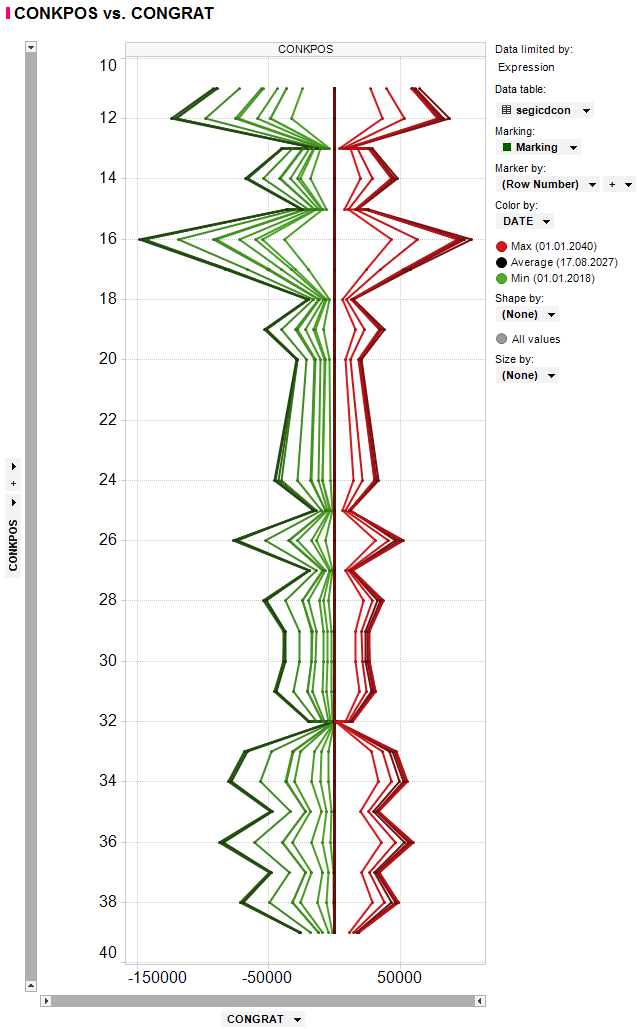
Vertical injector/producer analysis for a gas injector that is later converted
to a producer for the blowdown period (date indicated by colour). Gas inflow/outflow
plotted versus grid k-index. This if for a non-multisegment well, and
no segment data is available.

Column names
Vector |
Description |
|---|---|
CONDEPTH |
Depth at the centre of each connection in the well |
CONLENST |
Length down the tubing from the BH reference point to the start of the connection |
CONLENEN |
Length down the tubing from the BH reference point to the far end of the connection |
CONPRES |
Pressure in the wellbore at the connection |
CONORAT |
Oil production rate of the connection at surface conditions |
CONWRAT |
Water production rate of the connection at surface conditions |
CONGRAT |
Gas production rate of the connection at surface conditions |
CONOTUB |
Oil flow rate through the tubing at the start of the connection at surface conditions |
CONWTUB |
Water flow rate through the tubing at the start of the connection at surface conditions |
CONGTUB |
Gas flow rate through the tubing at the start of the connection at surface conditions |
CONVTUB |
Volumetric flow rate of the mixture at the start of the connection |
CONFAC |
Connection transmissibility factor |
CONKH |
Connection Kh value |
CONNXT |
Number of the neighbouring connection towards the wellhead |
CONSEGNO |
Segment number containing the connection |
CONBRNO |
Branch number containing the connection |
CONIPOS |
I location of the connection |
CONJPOS |
J location of the connection |
CONKPOS |
K location of the connection |
CONBDEPH |
Depth of the grid block of the connection |
CONBPRES |
Pressure of the grid block of the connection (Copy of the PRESSURE data) |
CONBSWAT |
Water saturation of the grid block of the connection |
CONBSGAS |
Gas saturation of the grid block of the connection |
CONBSOIL |
Oil saturation of the grid block of the connection |
COMPLETION |
Completion index of the connection |
CONMD |
Measured depth of the connection |
CONLENTH |
Length of the connection |
CONORATS |
Scaled oil production rate at surface conditions |
CONWRATS |
Scaled water production rate at surface conditions |
CONGRATS |
Scaled gas production rate at surface conditions |
SEGDEPTH |
Depth at the far end of each segment |
SEGLENST |
Length down the tubing from the zero tubing length reference point to the start of the segment |
SEGLELEN |
Length down the tubing from the zero tubing length reference point to the far end of the segment |
SEGXCORD |
X-coordinate at the far end of the segment (as entered by the 11th item of the WELSEGS record) |
SEGXCORD |
Y-coordinate at the far end of the segment (as entered by the 12th item of the WELSEGS record) |
SEGPRES |
Pressure in the wellbore at the far end of the segment |
SEGORAT |
Oil flow rate through the segment through its near end |
SEGWRAT |
Water flow rate through the segment through its near end |
SEGGRAT |
Gas flow rate through the segment through its near end |
SEGOVEL |
Free oil phase velocity through the segment |
SEGWVEL |
Water flow velocity through the segment |
SEGGVEL |
Free gas phase flow velocity through the segment |
SEGOHF |
Free oil phase holdup fraction in the segment |
SEGWHF |
Water holdup fraction in the segment |
SEGGHF |
Free gas phase holdup fraction in the segment |
SEGBRNO |
Branch number of the segment |
SEGNXT |
Number of the neighbouring segment towards the wellhead |
SEGMD |
Segment measured depth |
SEGLENTH |
Segment length |
SEGORATS |
Scaled water flow rate through the segment |
SEGWRATS |
Scaled water flow rate through the segment |
SEGGRATS |
Scaled gas flow rate through the segment |
SEGCORAT |
Summed connection oil flow rate through segment |
SEGCWRAT |
Summed connection water flow rate through segment |
SEGCGRAT |
Summer connection gas flow rate through segment |
SEGCORTS |
Scaled summed connection oil flow rate through segment |
SEGCWRTS |
Scaled summed connection water flow rate through segment |
SEGCGRTS |
Scaled summed connection gas flow rate through segment |
If addition, if you have branches with only one segment, these will be assumed
to represent ICD segments. The corresponding SEG* data for these ICD segments
will be joined to the segment they are connected to, and have their SEG* data
renamed to ICD*. For understanding your ICD* data, look at the description of
the analogue SEG* data above.