Generic Workflow
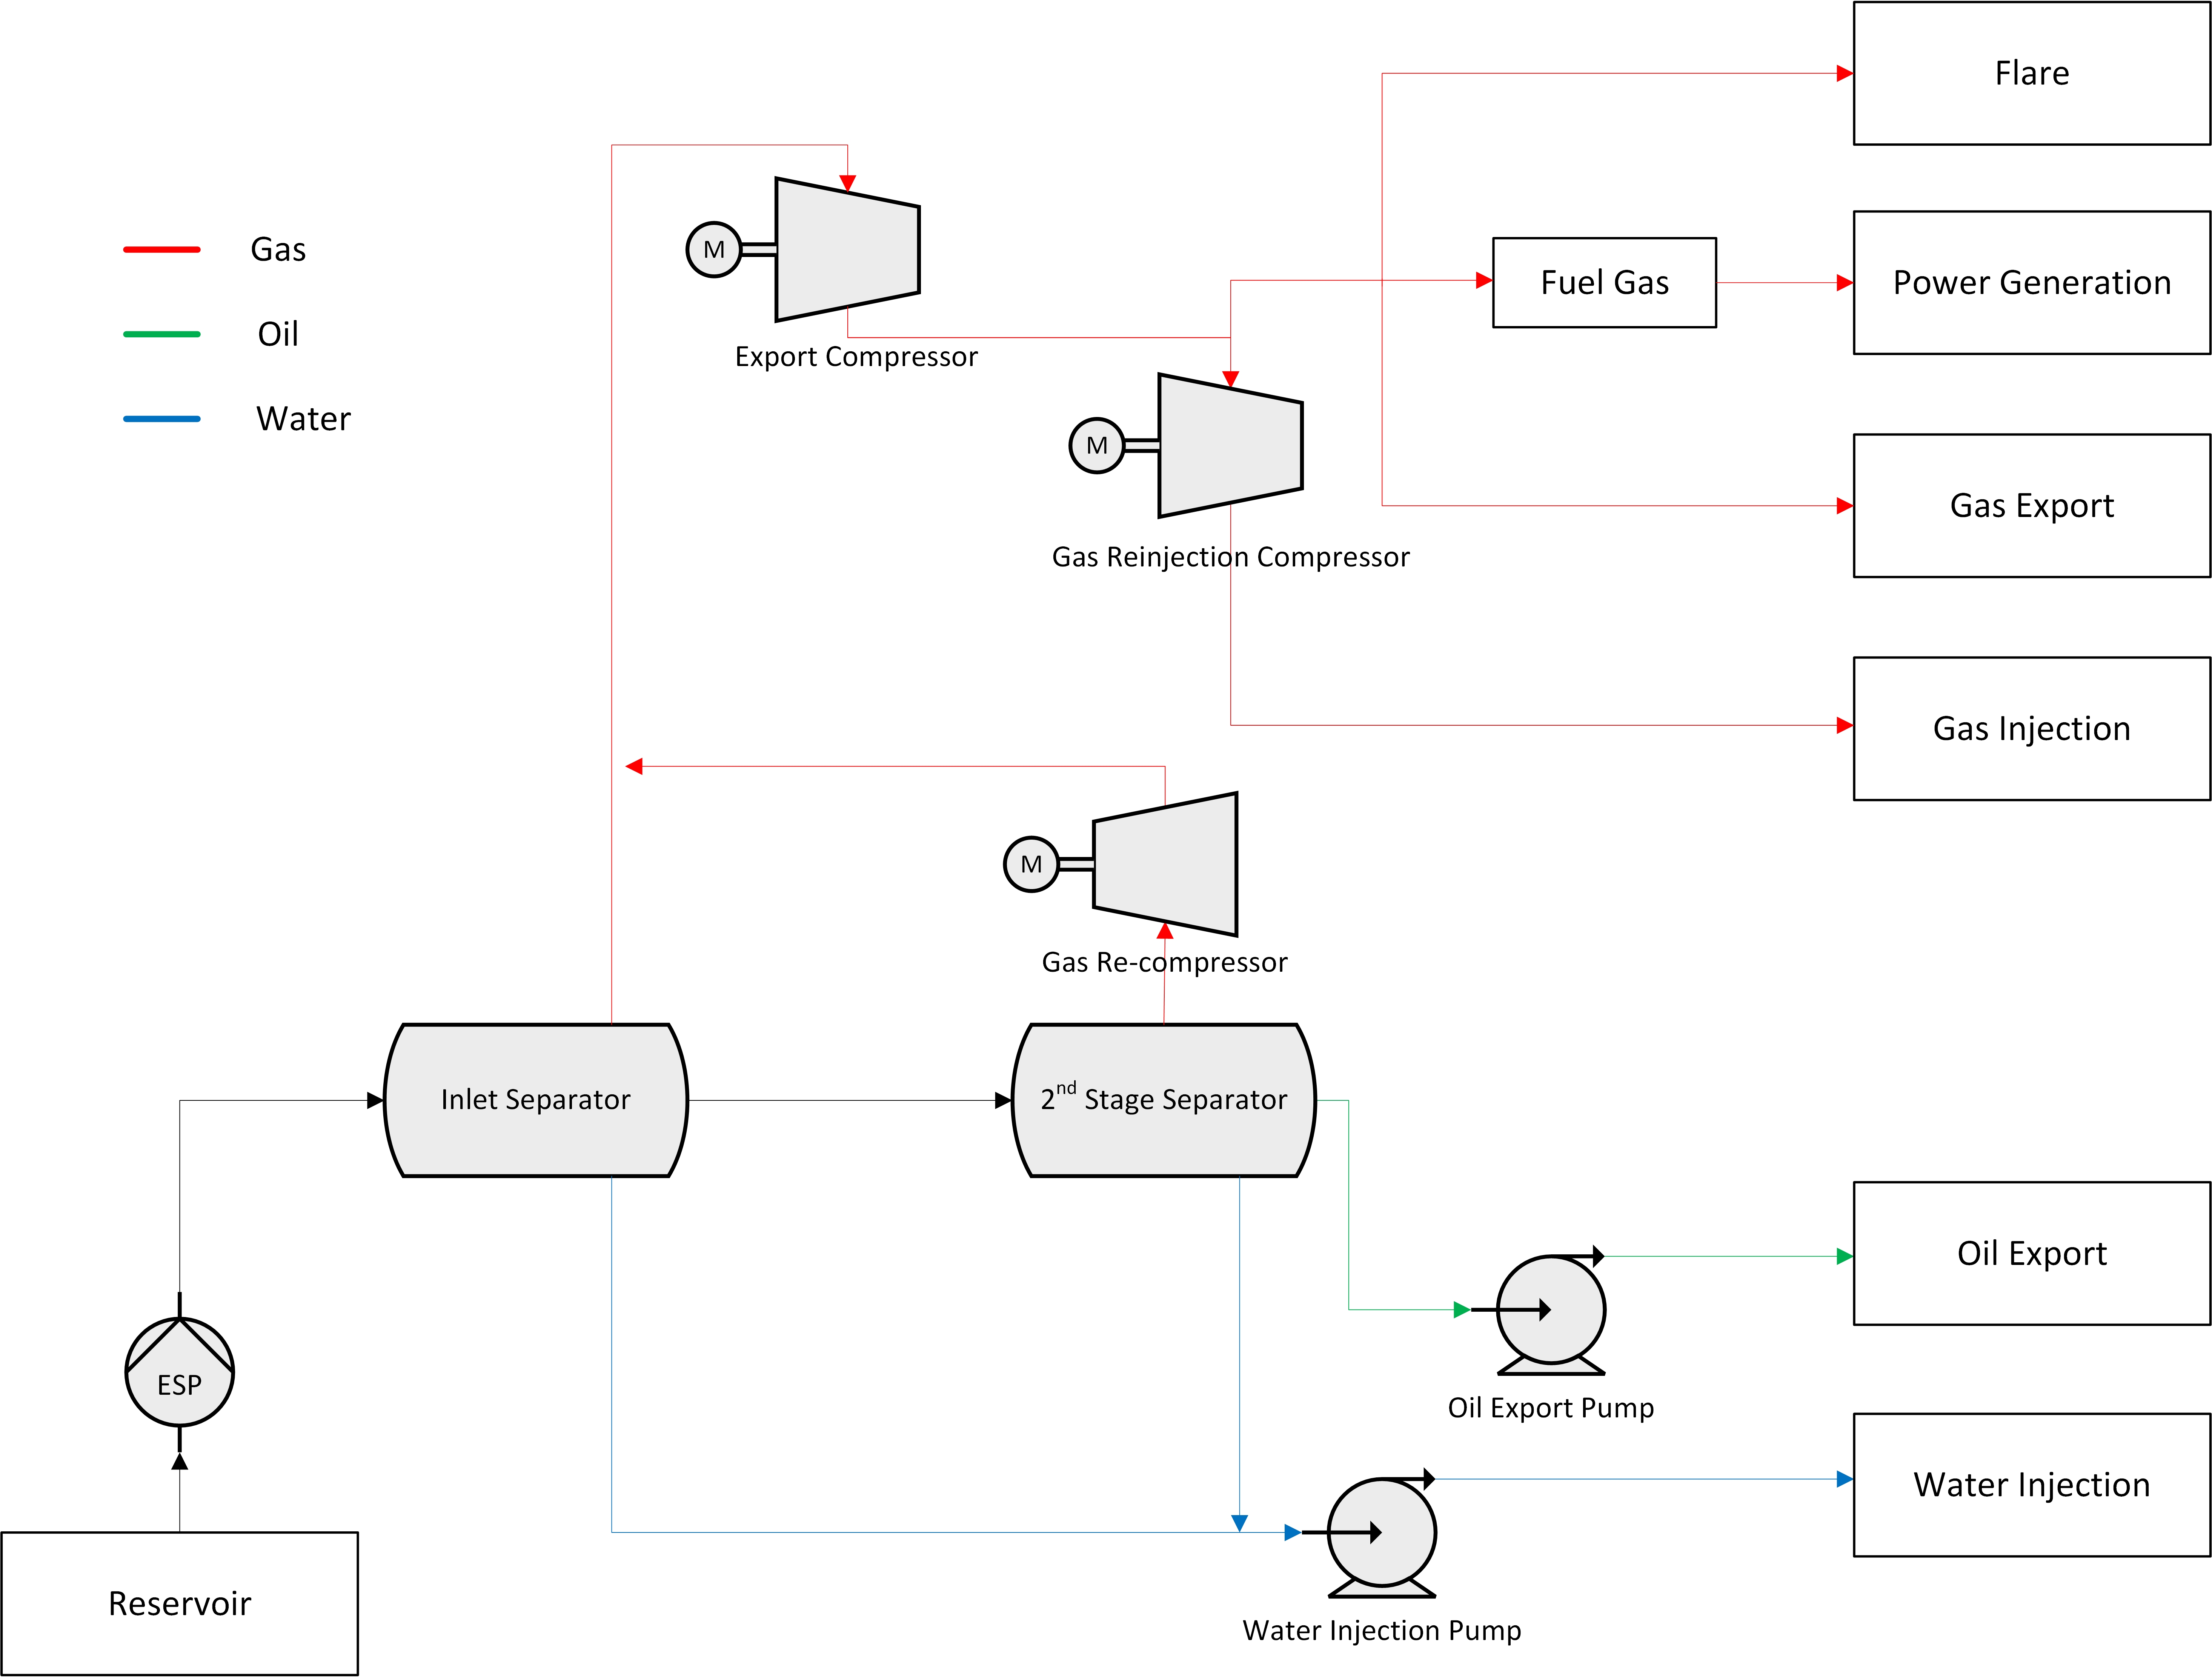
Simplified Process Flow Diagram
The image below illustrates a simplified process flow diagram for a generic offshore oil and gas facility. Each unit included in this diagram can be modelled with the use of eCalc. The workflow below will outline what is necessary to obtain for each step. In addition, there are some accompanied explanations to the workflow.

Workflow
Workflow Explanation
Required Subsurface Profiles
All subsurface profiles must be in calendar day rate Sm3/cd and with its PE (REGULARITY). This data must be inputted as a TIME-SERIES and references to how it is used in the facility or by a relevant consumer.
Facility Information
Constant Power Loads
To simplify certain models, there could be some common assumptions made. Here are some examples:
- Base Load: As eCalc™ is not simulating the whole facility there are often energy consumers that are not modelled. Typically, these energy consumers, related to things such as the energy consumption of living quarters and direct energy consumers, which are not varying with the amount of their production/injection, are often constant loads. These smaller constant loads are then grouped into a larger term, called the "baseload". This is assumed to be constant and independent of variations in the production rate and injection rate of the facility, but can be switched off it there is no injection or production.
- Recompressor: The main function of a recompressor is to compress gas from separator pressures back up to the inlet separator pressure. If this compressor is small and has little fluctuation in its load, or its processed gas rate and composition are unknown, thus, to simplify modelling, this recompressor could be modelled as a constant load. And at times, is included within the facility's base load
- Oil Export Pumps: These are normally modelled as constant loads because of little variation in the load, and the fact that they are small consumers.
Additional Information
Any emissions that do not fall within the defined categories can still be considered for a given platform. For example, if there are drilling activities, an additional fuel type can be specified and related to the fuel consumption of a drilling rig.
Consumer Information
Generator Set
As eCalc™ does not model gas turbine generators in depth, alternative methods are used. Here, fuel consumed and power generated is related in tabular form. These are typically linear relationships, and if more than one generator is used, "generator switching" is modelled by adding another generator curve on top of the existing.
This means that the facility will operate in the most efficient manner, i.e. meaning that if one generator will satisfy the power demand, only one generator will always be used.
Compressor Curves
eCalc™ has generic compressor curve functionality which can be used when compressor curves are not available. However, if a manufactor compressor chart is available, it is always recommended to use this over a generic chart. The generic compressor curves, use the assumption of constant polytropic efficiency, which is only a good assumption if the compressor is running near the design points.
Validation
Checking whether the eCalc™ model is valid or not is an essential task. If a model is not valid, this means that input requirements set by the user are not being fulfilled, or that some consumers are giving unrealistic solutions.
Validity can be checked by consumers, and there are often specific reasons why certain consumers are invalid. Therefore, it requires engineers not only to understand the validation of operation points (history data) from consumers, but also to know the specific limits of compressor or pump charts. The charts of consumers should fit their operation points. For example:
- Compressors and Pumps: It is common that either too high a head or rate value is specified. This means that the invalid point is outside the limits of the performance chart. To determine the issue, it is recommended that the operational points (Head, and actual flowrate) are plotted together with the chart.
- Generator Set: The most common issue here is that the amount of power required is higher than the maximum value in the utilised genset.
Before any chart adjustments are made, engineers should first verify who provide the input that the adjustments make sense.
Calibration
The term calibration in eCalc™ refers to the history matching of the facility. Essentially, real operational data is compared against the eCalc™ model results. If they do not correlate various changes are made to the model.
The main workflow with this would be to match every individual consumer, e.g. each pump and compressor. After that, it is the recommended to compare on the facility level (e.g. total power consumed or total fuel used), then various adjustments can be made. These adjustments can mean changes to the base load, shifting the compressor curves, or simply by using a POWERLOSSFACTOR.