QC in ResInsight
ResInsight is an open-source reservoir analysis application for 3D visualisation and post-processing of reservoir models. It can be used for QC of grids from pem and seismic cubes from sim2seis. At present, there is no file format for attribute maps and horizons that are common to both xtgeo and ResInsight.
Grids in ResInsight
Grid Import in ResInsight
It is possible to import grids and grid properties in .roff format. Grids and grid properties can be imported into a ResInsight project in one operation, or the grid properties can be added after the grid is imported.
Eclipse simulation runs can also be used to define the grid, and the results from pem can be added as properties. This enables cross-plotting of static and dynamic properties that are input to pem with pem results, allowing verification of their expected relationships.
File => Import => Roff Grid Models => Import ROFF Case
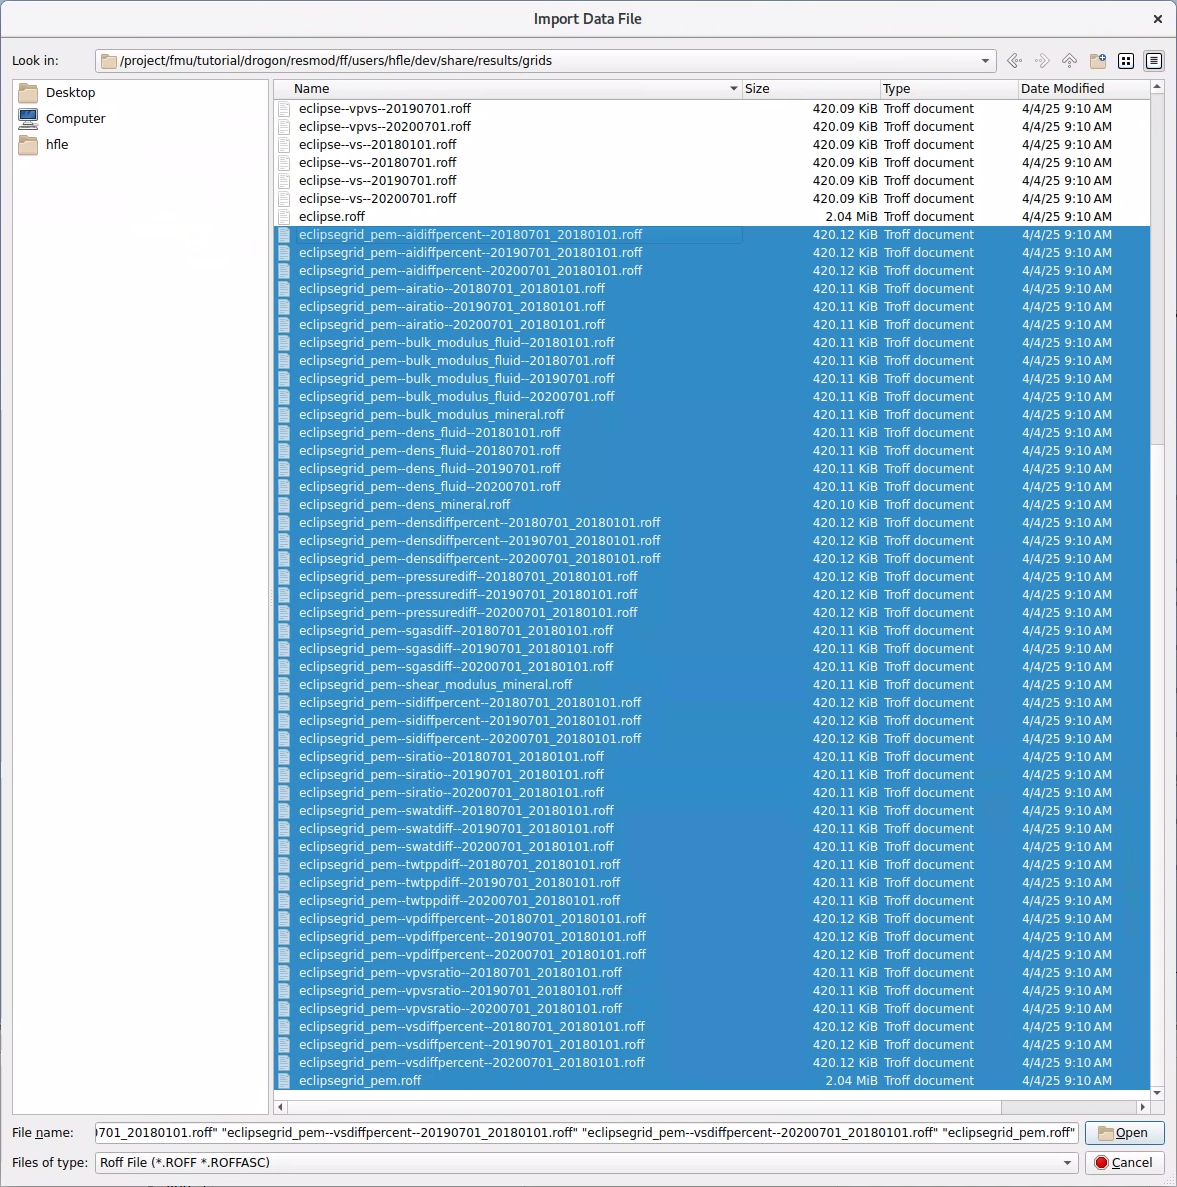 Figure 1: Import of grid and grid properties to ResInsight.
Grid Visualisation
3D visualisation of grid properties is available once the grid and properties are loaded. A 3D view is set up by default, and it can be modified through the Property Editor. In the 3D View properties under the grid, the selection of which property to display is done via the Cell Result property. Other properties can be explored, such as colour legends, property filters, annotations, etc.
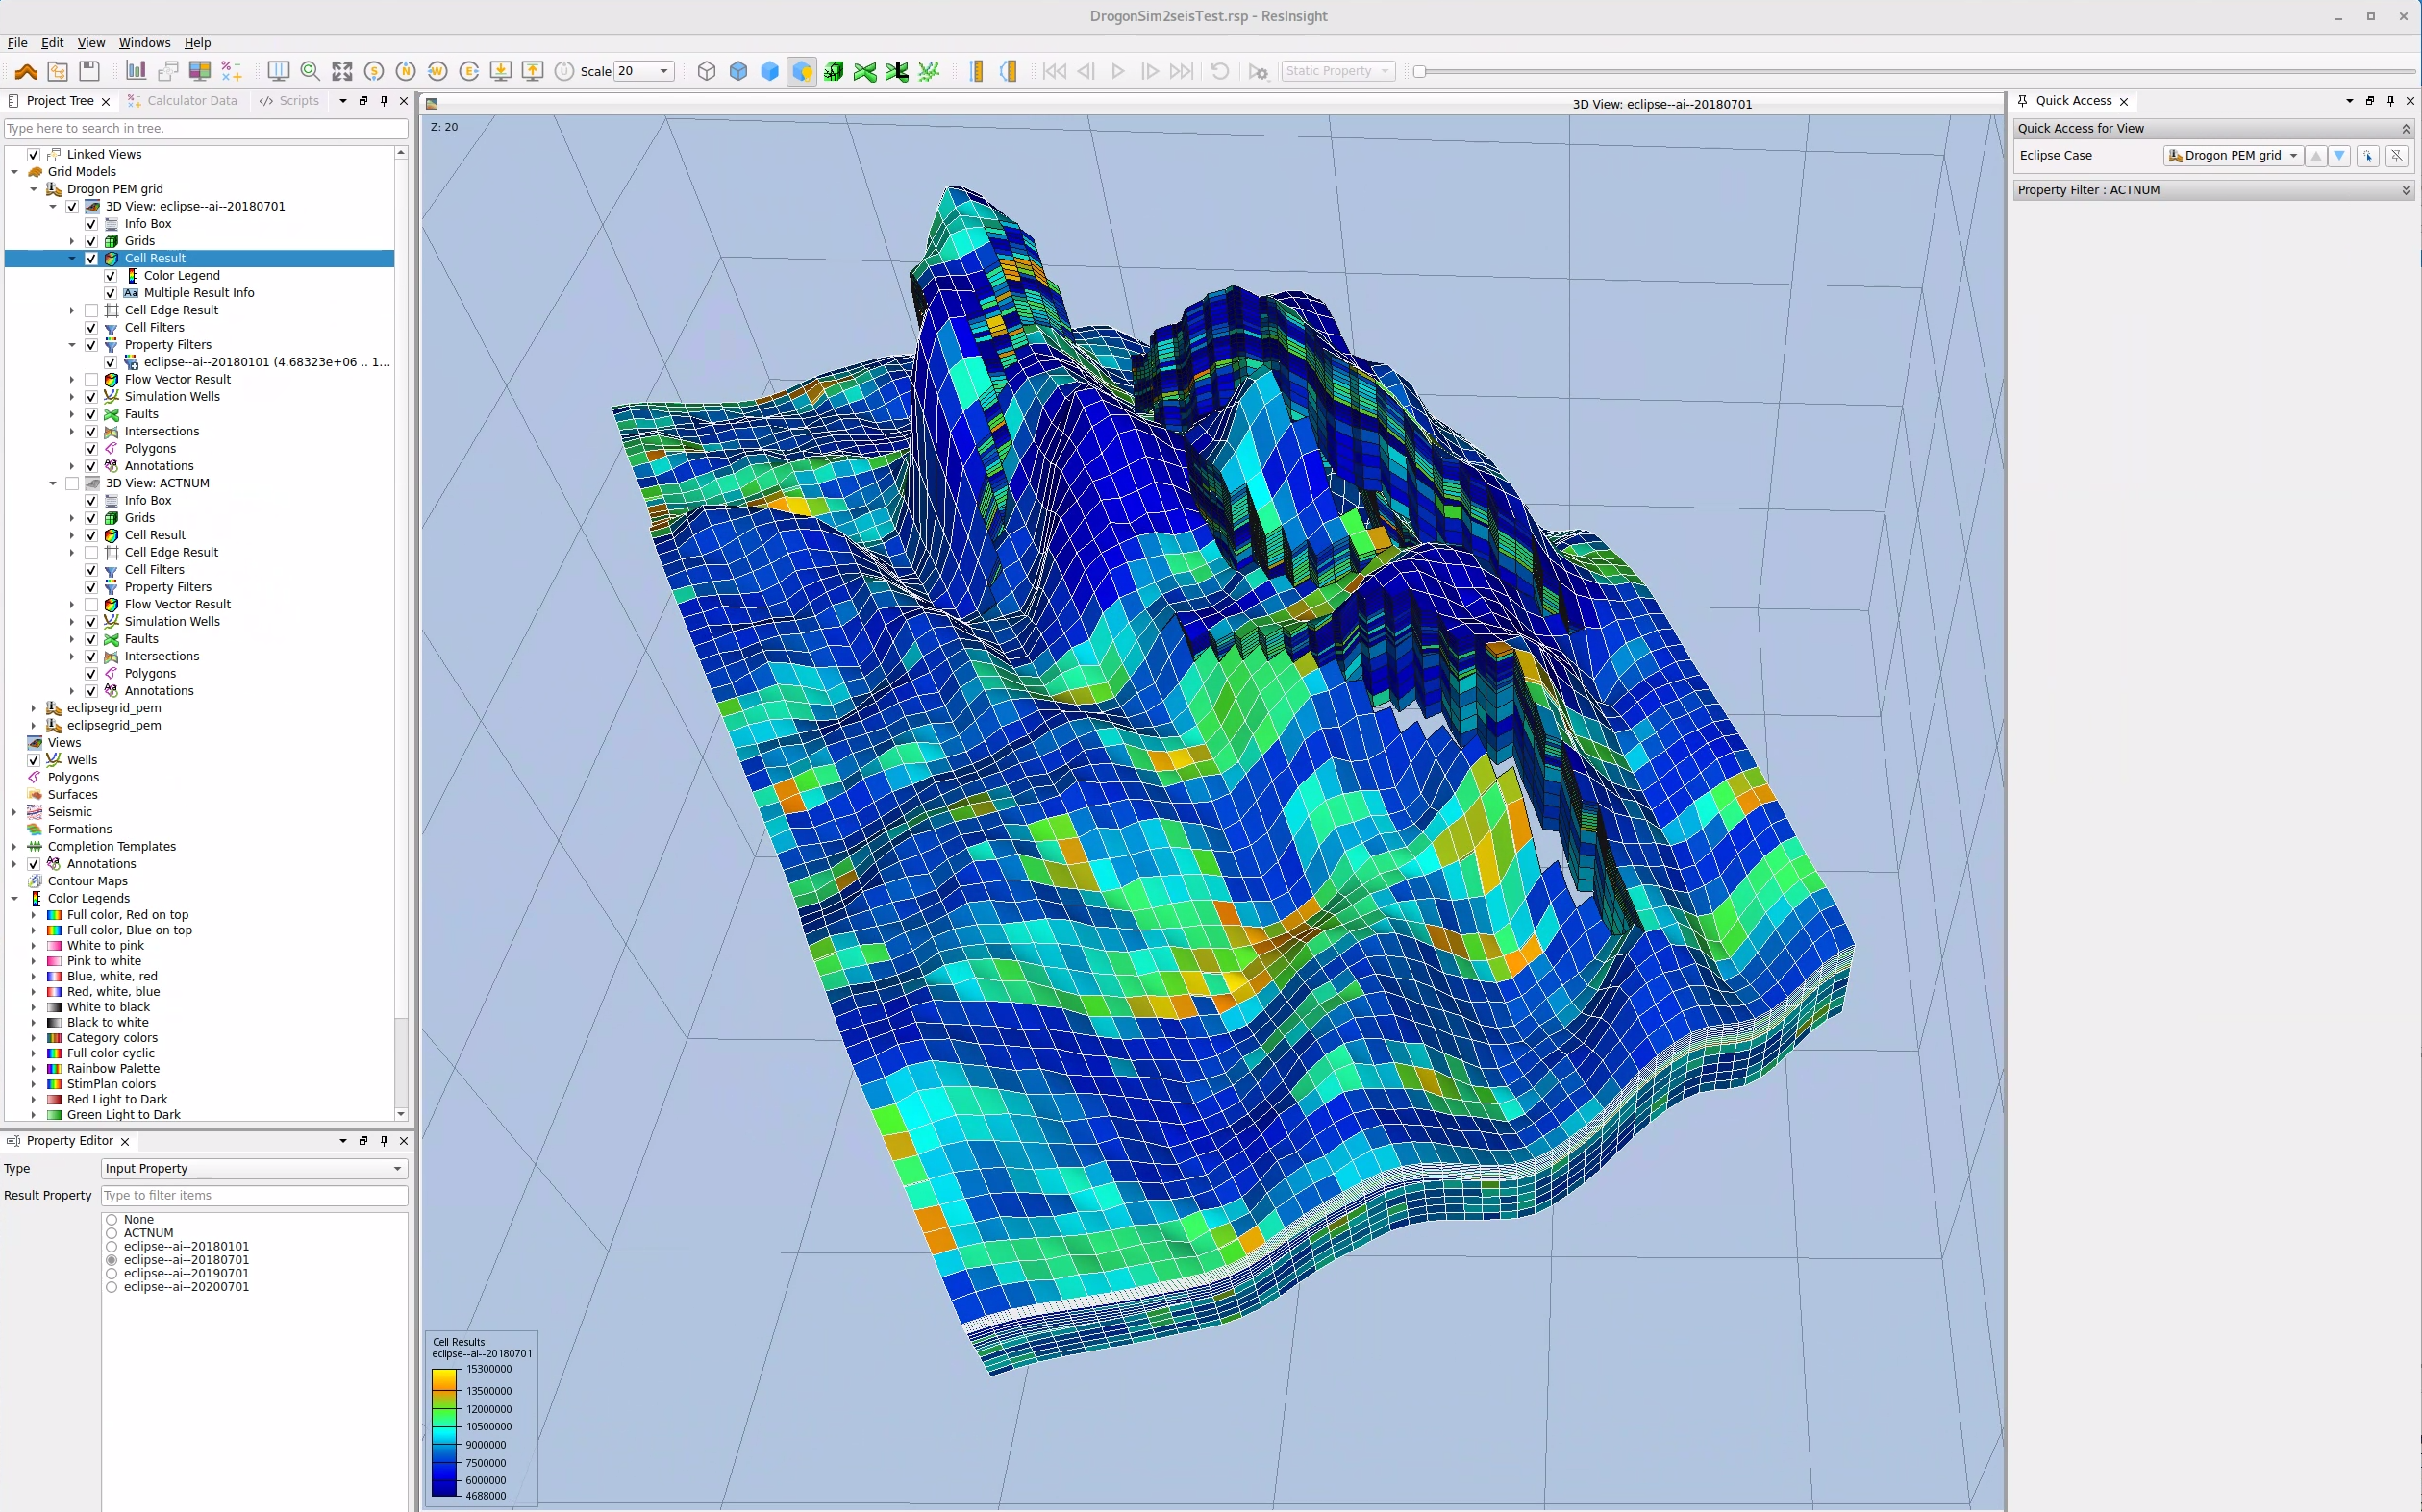 Figure 2: 3D view of AI property.
Grid Analysis
There are multiple options for grid analysis in ResInsight. Cross-plots between grid properties, i.e. results from pem can be combined with eclipse init or unrst (static or dynamic) properties. Cross-plots are part of the Plot Window options in ResInsight. Histogram of grids and cumulative histogram can be found in either the Plot Window, or as a right-click option in the 3D display background.
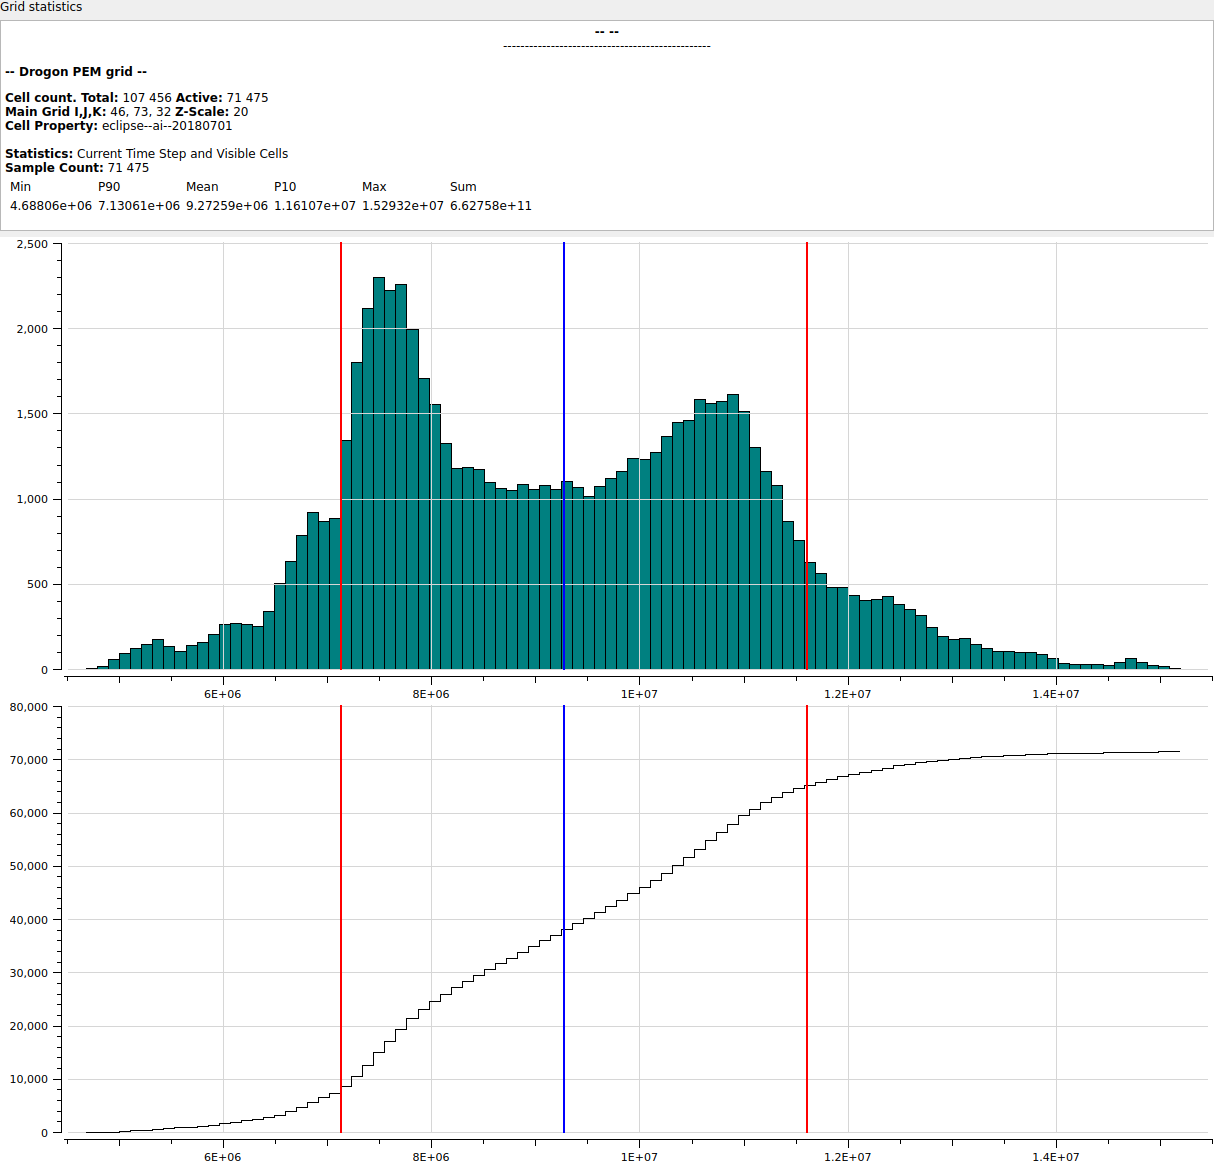 Figure 3: Grid histogram is available as a right-click option in 3D view.
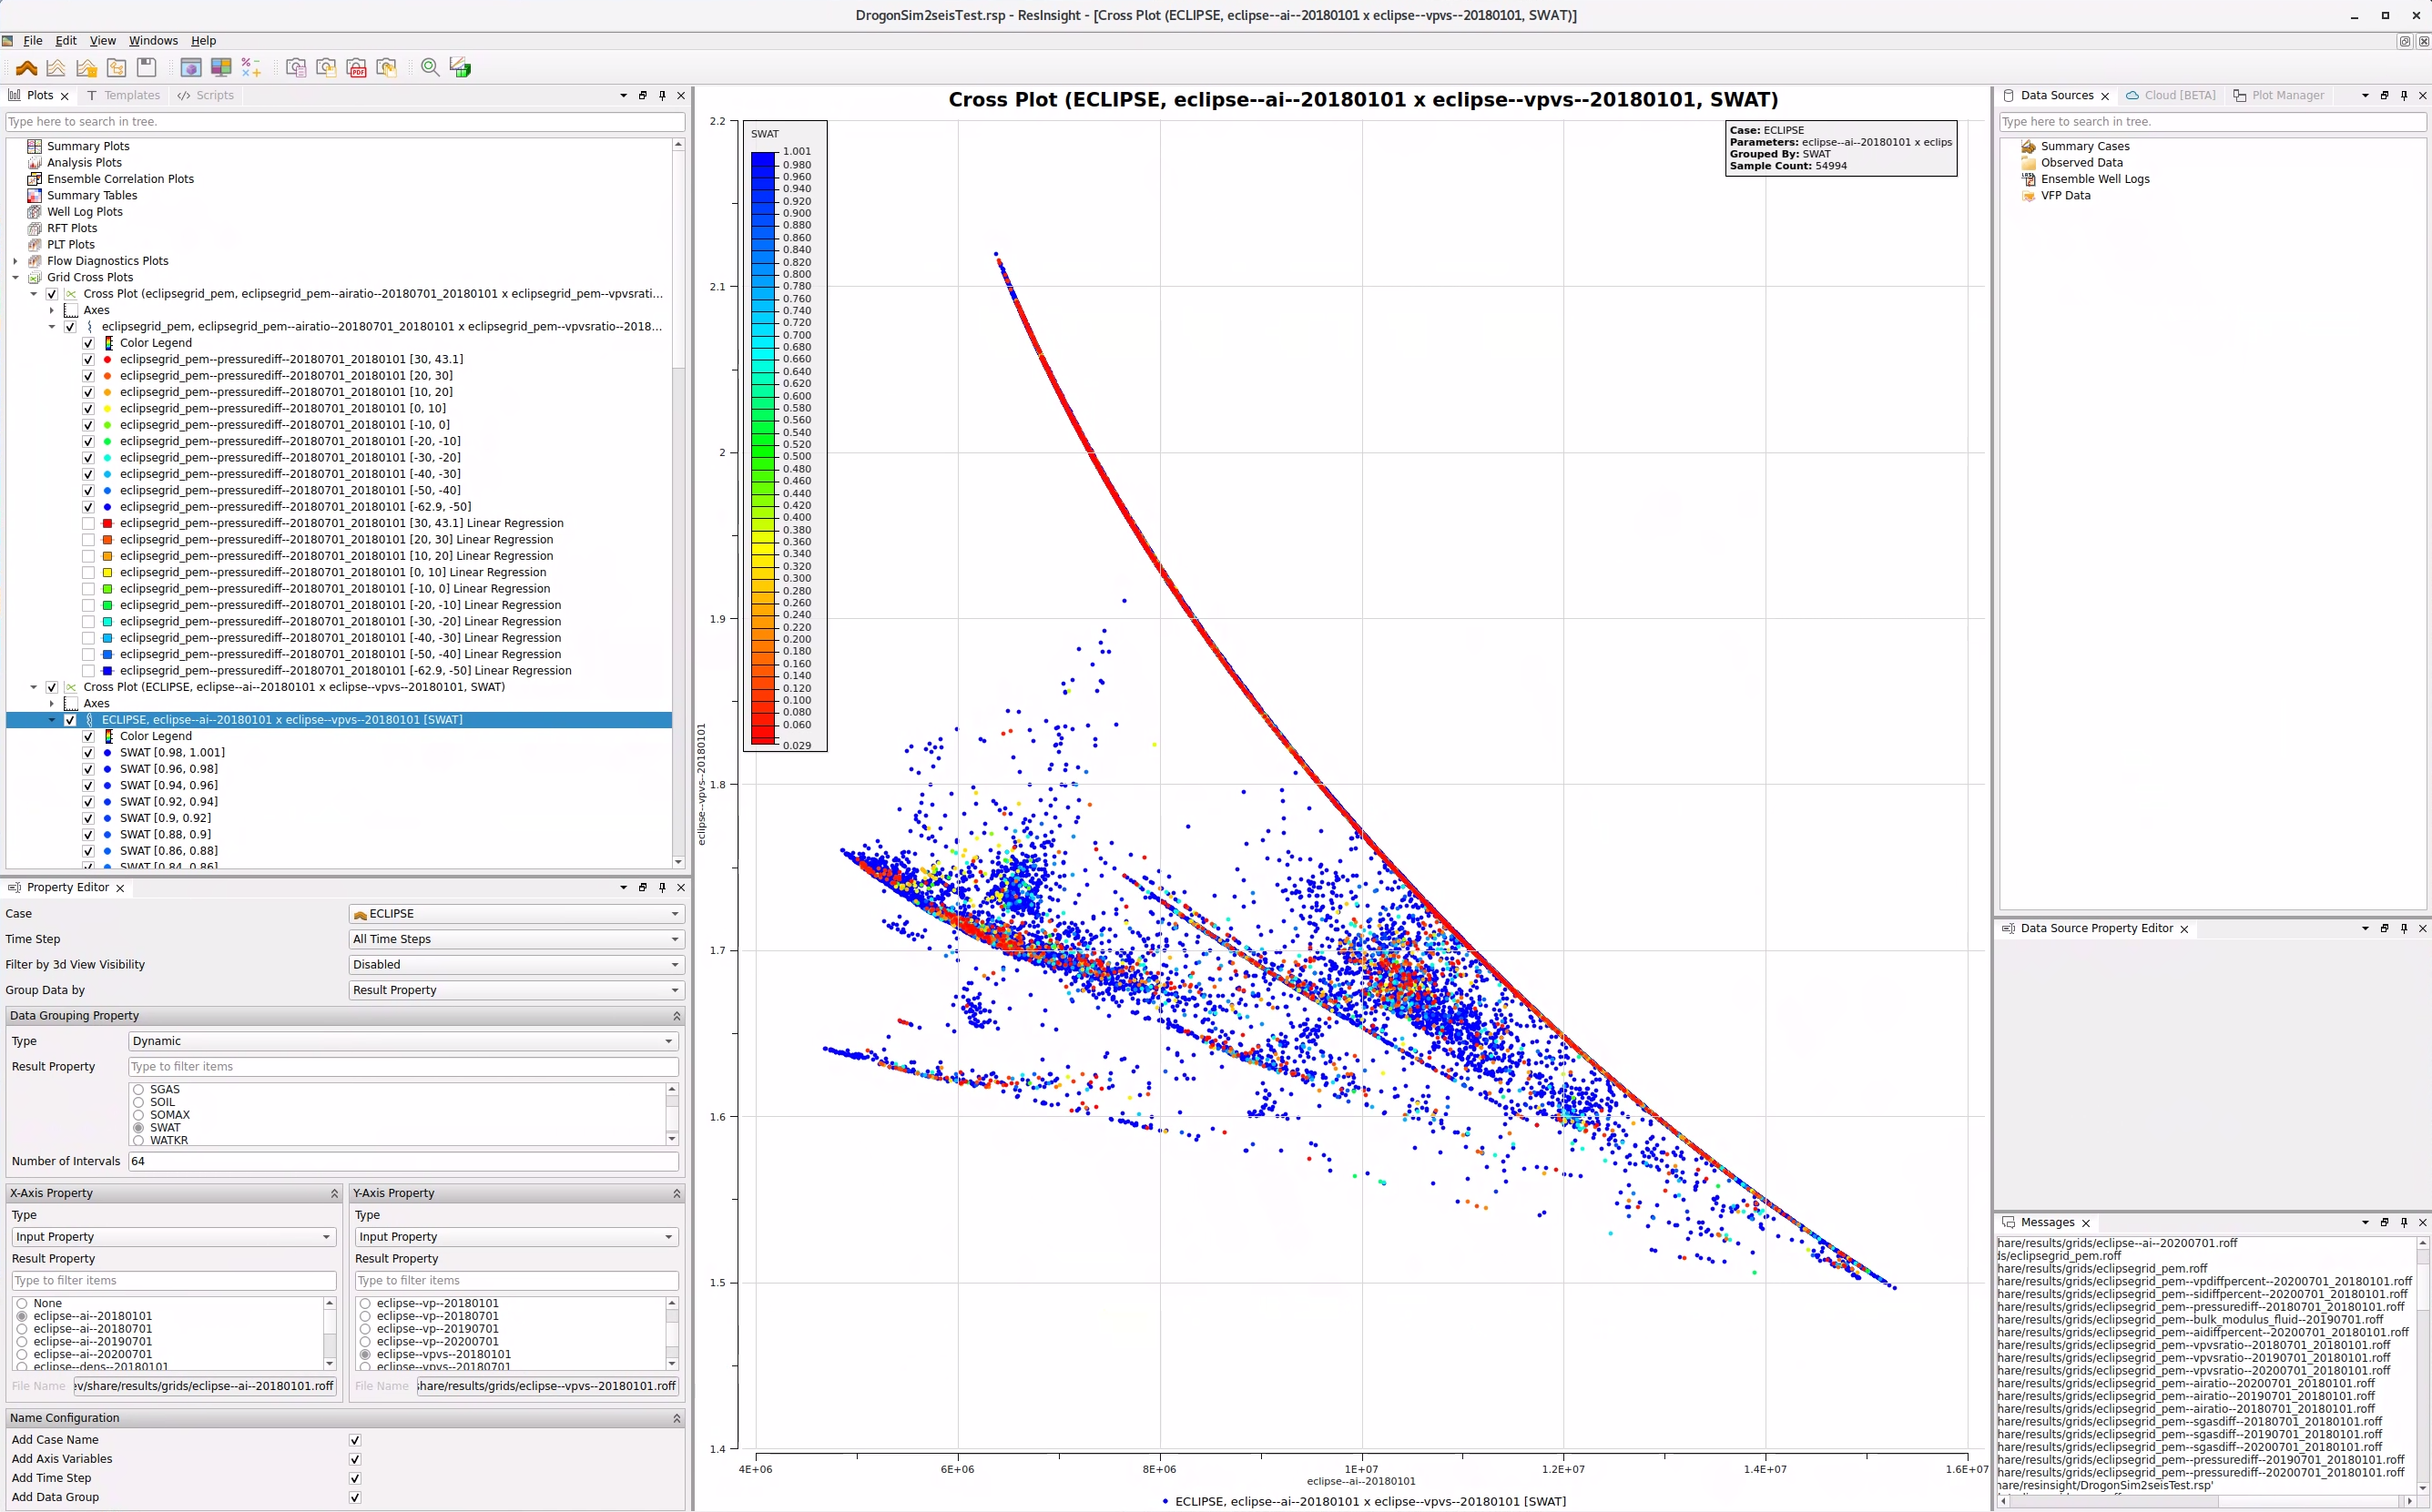 Figure 4: Cross-plot with Vp/Vs plotted against AI, with colour coding by water saturation.
Cubes in ResInsight
Segy cubes must be imported one at a time to ResInsight. Cubes can be visualised on their own or with well data through Seismic View, but more interesting will be to combine the seismic cubes with grid properties through Seismic Section. There are currently no particular options for analysis of seismic data, except for histogram.
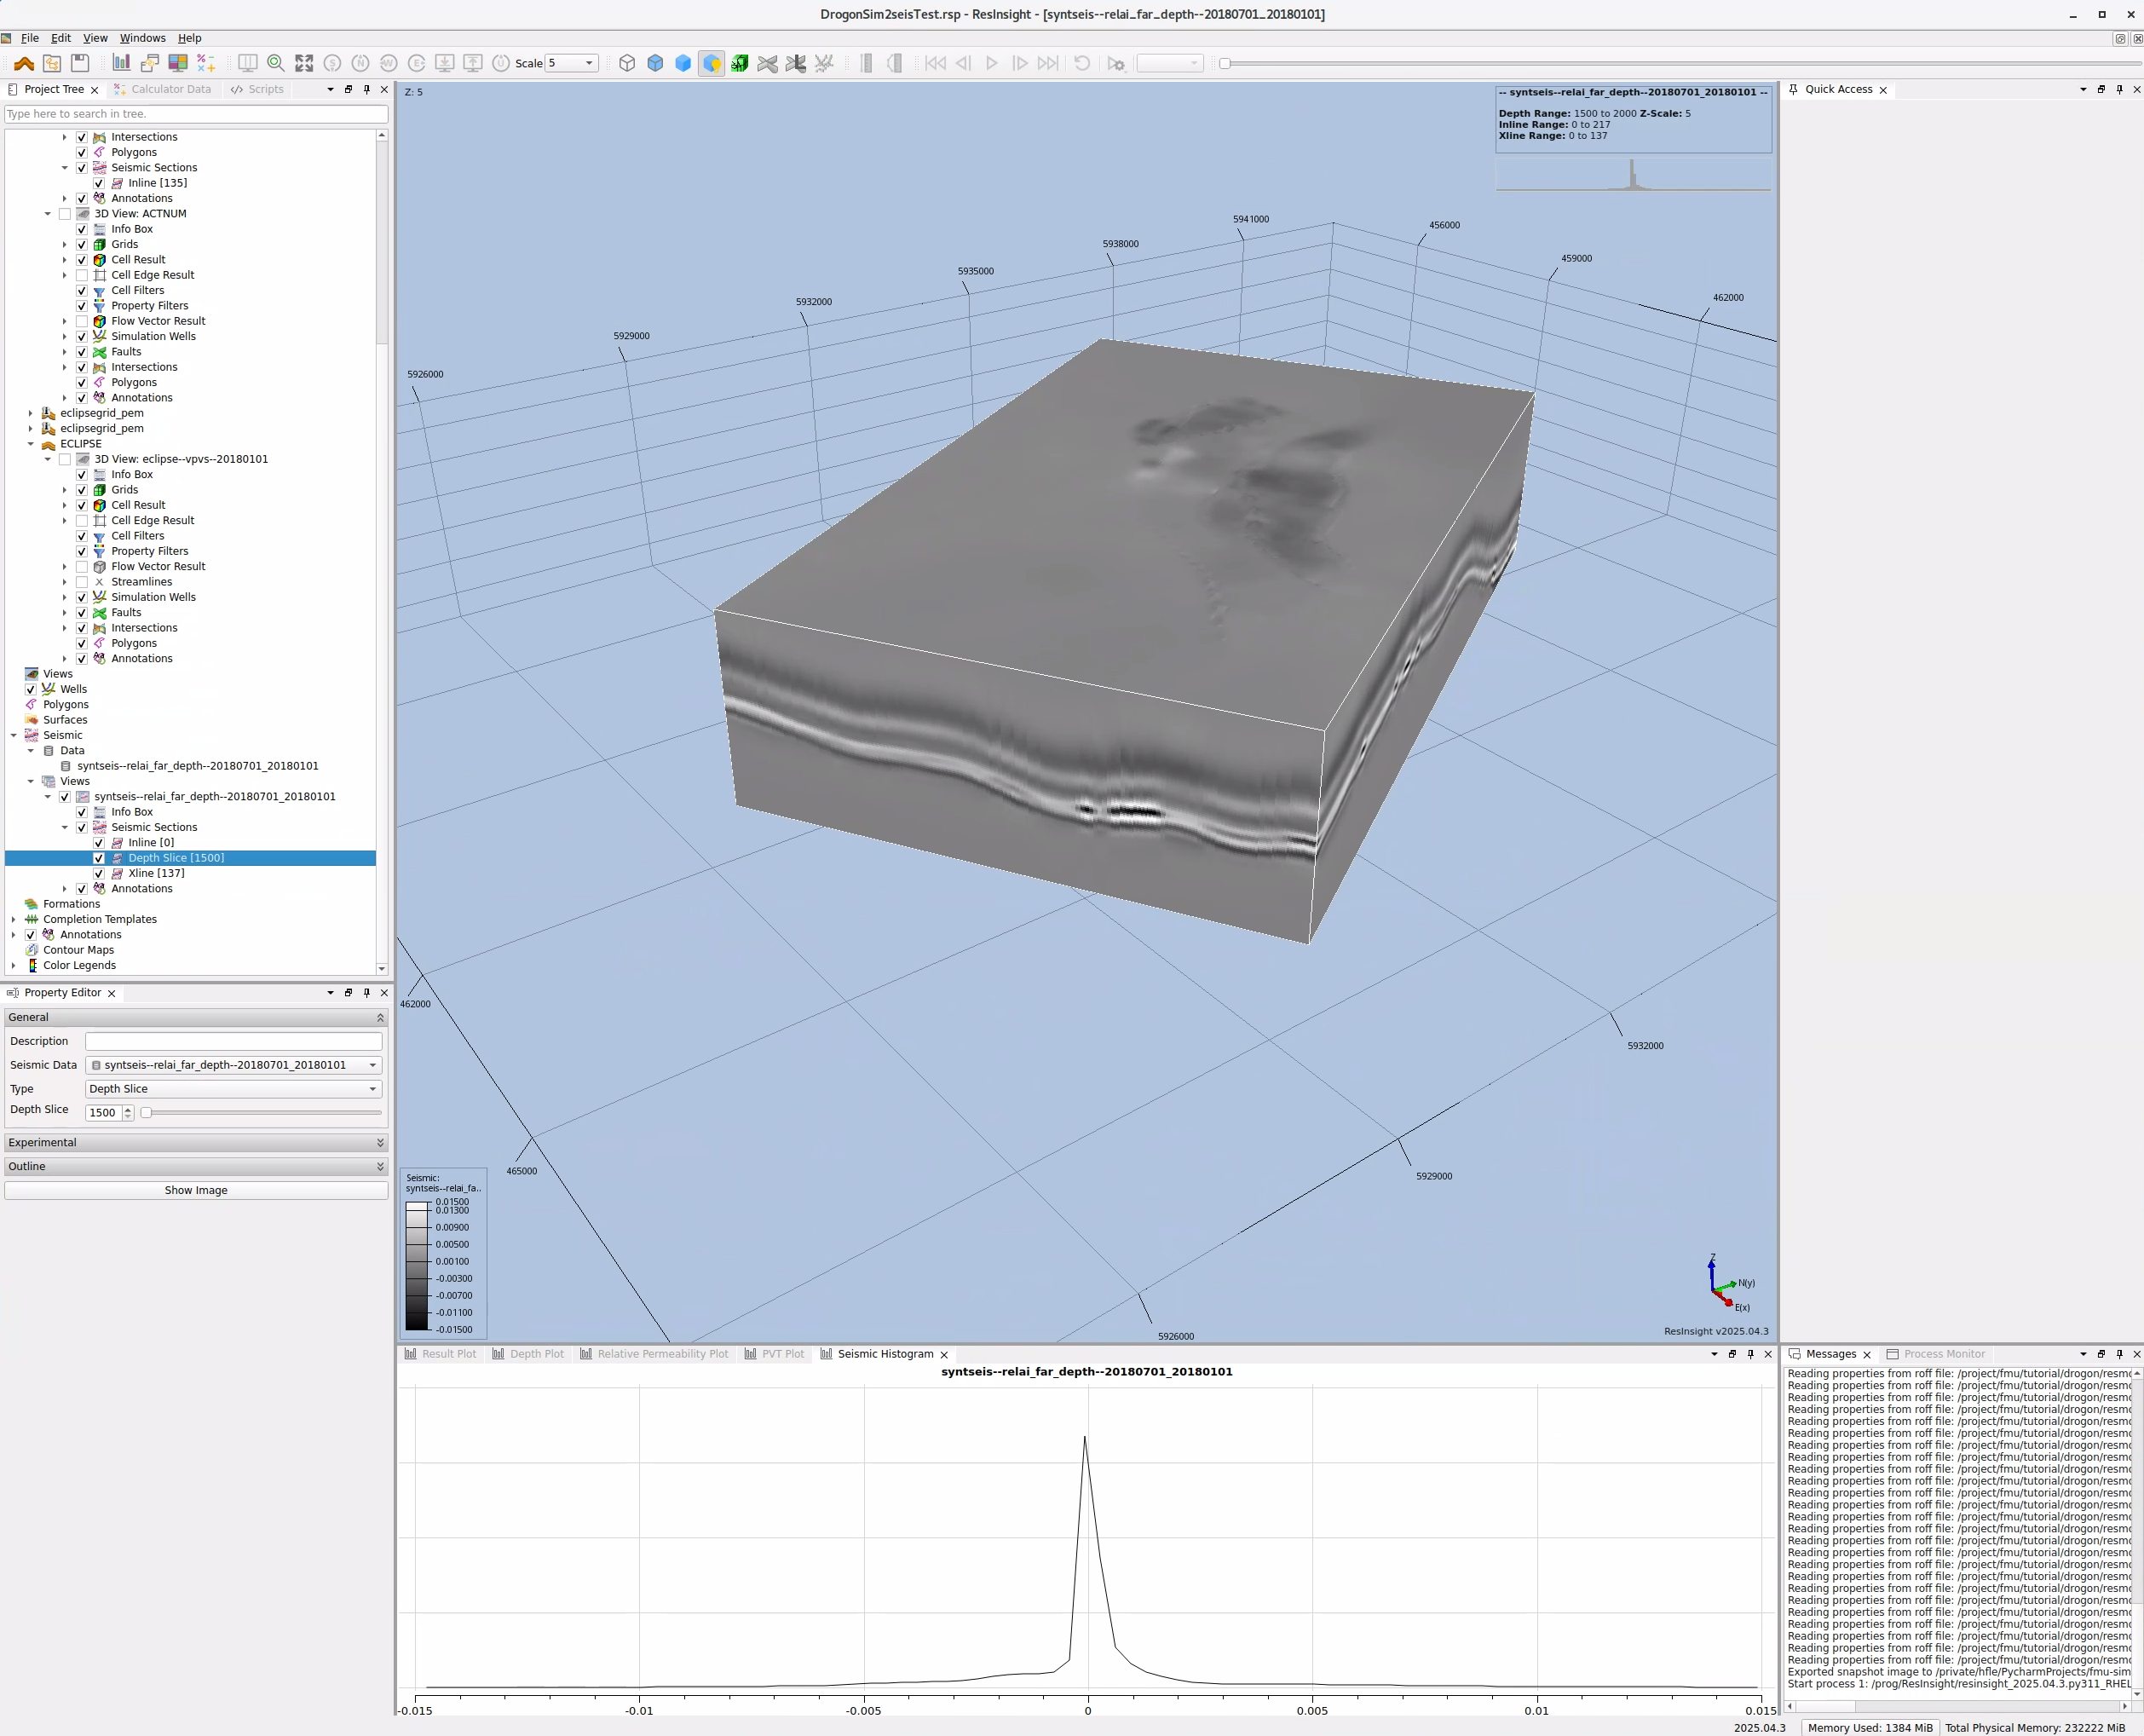 Figure 5: Seismic cube can be visualised with inline, crossline or timeslice.
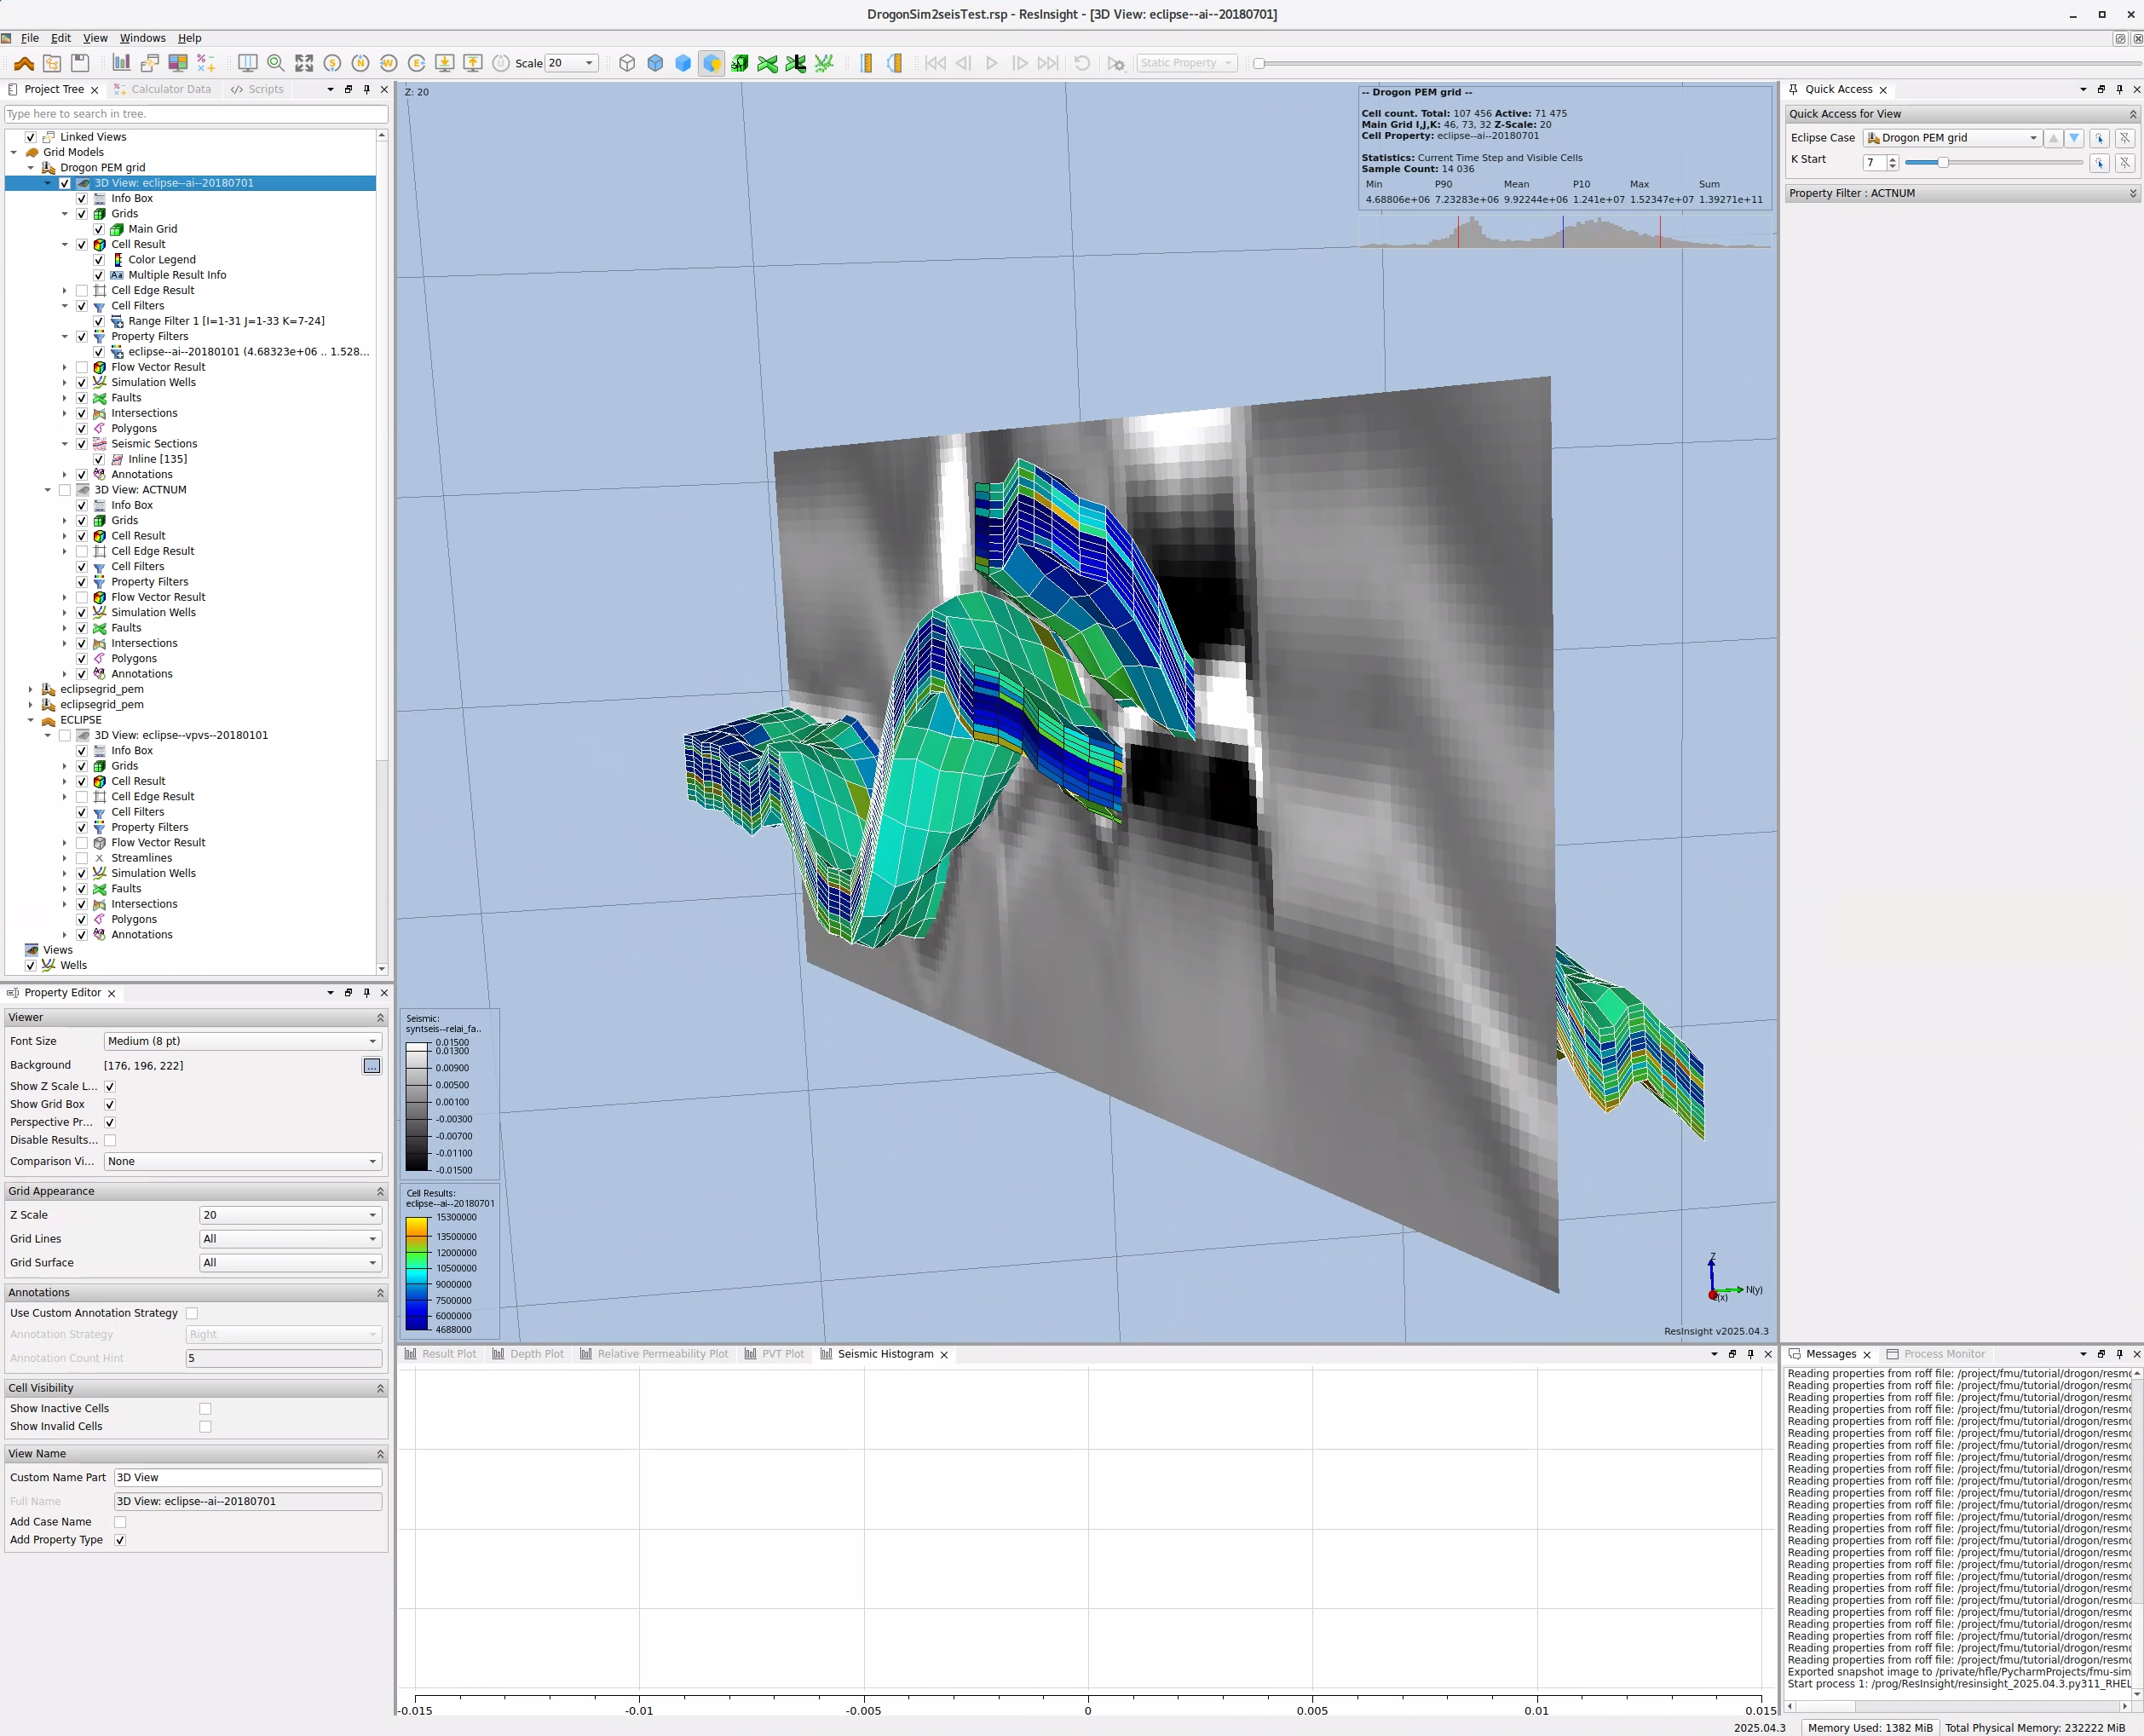 Figure 6: Grid property combined with a seismic section.