Note
Go to the end to download the full example code.
Loss function parameters
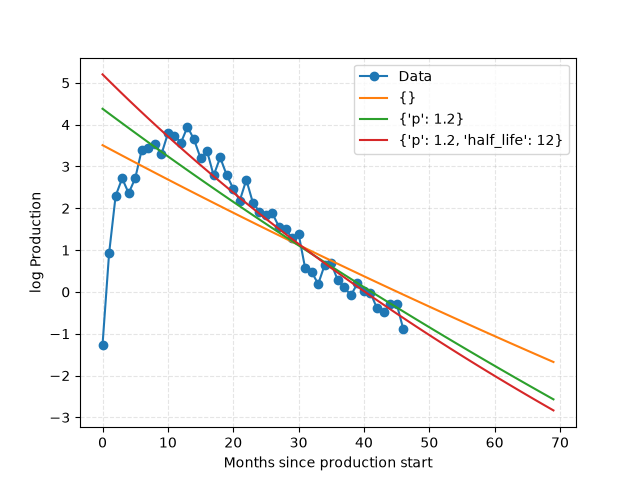
Tweaking loss function parameters.
import matplotlib.pyplot as plt
import numpy as np
from scipy.optimize import minimize

from dca.datasets import load_monthly_sodir_production
from dca.decline_curve_analysis import Arps, CurveLoss

# Load data to fit to
df = (
    load_monthly_sodir_production()
    .loc[lambda df: df["prfInformationCarrier"] == "STATFJORD", :]
    .groupby("prfYear")["prfPrdOilNetMillSm3"]
    .sum()
)

# We fit the log-data to a log-model, and we shift the x-values
rng = np.random.default_rng(42)
x = df.index - df.index.min()
x_eval = np.linspace(0, np.max(x) * 1.5)
y = np.log(df.values) + rng.normal(loc=0, scale=0.3, size=len(x))
plt.plot(x, y, "-o", label="Data")


def log_arps(t, theta1, theta2, theta3):
    """Curve function to fit to."""
    return Arps(theta1, theta2, theta3).eval_log(t)


def log_arps_grad(t, theta1, theta2, theta3):
    """Evaluate the gradient of the log of the Arps model."""
    return Arps(theta1, theta2, theta3).eval_grad_log(t)


# Default parameters
parameters = {"p": 2, "half_life": np.inf}

parameter_diffs = [
    {},  # ALl default
    {"p": 1.2},  # Median regression
    {"p": 1.2, "half_life": 12},
]

for parameter_diff in parameter_diffs:
    loss_params = {**parameters, **parameter_diff}
    mu = np.array([6, 2, 0])
    loss_function = CurveLoss(
        curve_func=log_arps,
        curve_func_grad=log_arps_grad,
        mu=mu,
        precision_matrix=np.eye(3) * 2e-1,
        **loss_params,
    )

    # Optimize the function
    optimization_result = minimize(
        loss_function,
        x0=mu,
        method="BFGS",
        jac=loss_function.grad,  # Use gradient information
        args=(
            x,
            y,
        ),
    )
    assert optimization_result.success
    optimal_parameters = optimization_result.x

    # Plot
    curve = Arps(*optimal_parameters)
    plt.plot(x_eval, curve.eval_log(x_eval), label=f"{parameter_diff}")


# Plot the results
plt.xlabel("Months since production start")
plt.ylabel("log Production")
plt.grid(True, ls="--", alpha=0.33)
plt.legend()
plt.show()
Total running time of the script: (0 minutes 0.119 seconds)