Note
Go to the end to download the full example code.
Simulation game
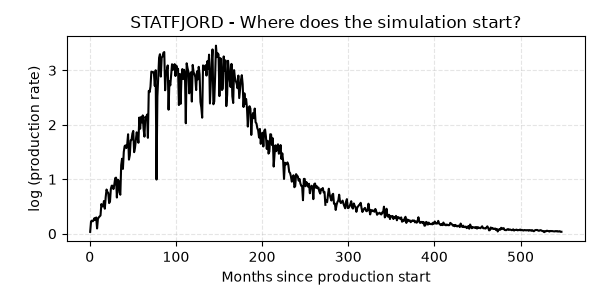
A high quality simulation should be indistinguishable from observed data. Can you guess where the training data ends and the simulation begins?
import matplotlib.pyplot as plt
import numpy as np
import pandas as pd

from dca.adca.well import Well
from dca.datasets import load_monthly_sodir_production

# Choose a field and whether or not to show the answer in the plot
FIELD = "STATFJORD"
SHOW_ANSWER = False


# Read data from a public source (SODIR - sokkeldirektoratet)
df = (
    load_monthly_sodir_production()
    .loc[lambda df: df.prfInformationCarrier == FIELD, :]
    .rename(
        columns={
            "prfInformationCarrier": "field",
            "prfYear": "year",
            "prfMonth": "month",
            "prfPrdOilNetMillSm3": "production",
        }
    )
    .assign(day=1)
    .assign(
        time=lambda df: pd.to_datetime(df[["year", "month", "day"]]).dt.to_period(
            freq="M"
        )
    )
    .loc[lambda df: df.production > 0]
)


# Create a well
well = Well(
    production=df.production.to_numpy(),
    time=df.time,
    id=FIELD,
    preprocessing="producing_time",
    curve_model="arps",
)


# Fit the well
SPLIT = 0.5
HALF_LIFE = 24
well = well.fit(half_life=HALF_LIFE, prior_strength=1, split=SPLIT)

# Get arrays to simulate on and compute prev_eta on
(x_train, y_train, w_train), (x_test, y_test, w_test) = well.get_train_test(split=SPLIT)
preds_train = well.predict(x_train, time_on=w_train, q=0.5)

# Prev eta is how far off the most recent training data prediction is
prev_eta = (np.log(y_train) - np.log(preds_train))[-1]

# Simulate
simulations = well.simulate(
    x_test,
    time_on=w_test,
    prev_eta=prev_eta,
    seed=42,
    simulations=9,
)


# Create plot
fig, ax = plt.subplots(figsize=(6, 3))
ax.set_title(f"{FIELD} - Where does the simulation start?")

ax.plot(x_train, y_train, color="black")

# If the answer is to be shown, plot the decline curve
if SHOW_ANSWER:
    x, y, w = well.get_curve_data()
    preds = well.predict(x, time_on=w, q=0.5)
    i = well.get_split_index(split=SPLIT) - HALF_LIFE * 3
    ax.plot(x[i:], preds[i:], color="orange", zorder=10, label="DCA curve")


# Plot a single simulation (change to plot several)
for j in range(1):
    color = None if SHOW_ANSWER else "black"
    label = "Simulation" if SHOW_ANSWER else None
    ax.plot(x_test, simulations[j, :], color=color, zorder=5, label=label)


ax.set_ylabel("log (production rate)")
ax.set_xlabel("Months since production start")
ax.grid(True, ls="--", alpha=0.33)
if SHOW_ANSWER:
    ax.legend()
fig.tight_layout()
plt.show()
Total running time of the script: (0 minutes 0.421 seconds)