Note
Go to the end to download the full example code.
Effect of prior
We show how the prior works. As more and more data is seen, the effect of the prior lessens.
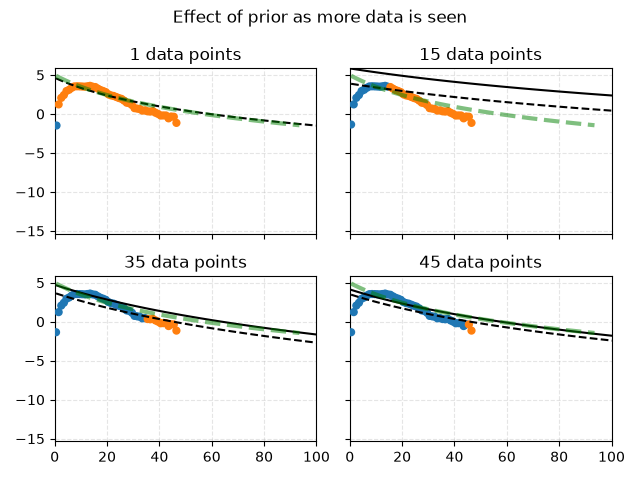
/home/runner/work/decline-curve-analysis/decline-curve-analysis/examples/plot_prior_effect.py:31: Pandas4Warning: Passing integer data to PeriodArray/PeriodIndex is deprecated and will change behavior in a future version, when integers will be treated as period ordinals instead of calendar years. To get the future behavior now, use PeriodIndex.from_ordinals(data, freq=...). To retain the current behavior, pass strings, e.g. data.astype(str).
  time = pd.PeriodIndex(series.index, freq="Y")
import itertools

import matplotlib.pyplot as plt
import numpy as np
import pandas as pd
import scipy as sp

from dca.adca.well import Well
from dca.datasets import load_monthly_sodir_production
from dca.decline_curve_analysis import Arps
from dca.models import beta_logpdf_grad, gamma_logpdf_grad

# Load data to fit to
series = (
    load_monthly_sodir_production()
    .loc[lambda df: df["prfInformationCarrier"] == "STATFJORD", :]
    .groupby("prfYear")["prfPrdOilNetMillSm3"]
    .sum()
).iloc[:]

time = pd.PeriodIndex(series.index, freq="Y")
well = Well(time=time, production=series.to_numpy())

PRIOR_MEAN = np.array([7, 2, -1])


class Prior:
    def __init__(self, prior_mean):
        self.prior_mean = np.array(prior_mean)

    def __call__(self, theta, sigma, phi, p, prior_strength):
        theta_prior = sp.stats.multivariate_normal(mean=self.prior_mean)
        sigma_prior = sp.stats.gamma(a=1.5, scale=10)
        phi_prior = sp.stats.beta(2, 2)
        p_prior = sp.stats.beta(2, 2)

        neg_log_pdf = -prior_strength * (
            theta_prior.logpdf(theta)
            + sigma_prior.logpdf(sigma)
            + phi_prior.logpdf(phi)
            + p_prior.logpdf(p - 1)
        )
        return neg_log_pdf

    def gradient(self, theta, sigma, phi, p, prior_strength):
        # Gradient
        grad_theta = self.prior_mean - theta
        grad_sigma = gamma_logpdf_grad(sigma, scale=10, a=1.5)
        grad_phi = beta_logpdf_grad(phi, a=2, b=2)
        grad_p = beta_logpdf_grad(p - 1, a=2, b=2)

        gradients = [grad_theta, grad_sigma, grad_phi, grad_p]
        # Flatten: [2, [3, 4]] => [2, 3, 4]
        chained = list(itertools.chain(*(np.atleast_1d(g) for g in gradients)))
        return -prior_strength * np.array(chained)


neg_logpdf_prior = Prior(prior_mean=PRIOR_MEAN)


fig, axes = plt.subplots(2, 2, sharex=True, sharey=True)
fig.suptitle("Effect of prior as more data is seen")
axes = iter(axes.ravel())
time = np.arange(2 * len(series)) + 0.5  # For plotting prior

# Loop over number of data points
for split in [1, 15, 35, 45]:
    ax = next(axes)

    # Plot the prior
    prior_curve = Arps(*PRIOR_MEAN)
    ax.plot(
        time,
        prior_curve.eval_log(time),
        color="green",
        zorder=99,
        alpha=0.5,
        ls="--",
        lw=3,
    )

    # Fit a Well using the desired number of data points in `split`
    well = well.fit(
        half_life=12,
        prior_strength=1,
        split=split,
        neg_logpdf_prior=neg_logpdf_prior,
    )

    # Plot the well, clean up the axis
    well.plot(split=split, logscale=True, ax=ax, q=[0.5])
    ax.set_title(f"{split} data points")
    ax.get_legend().remove()
    ax.set_xlabel("")
    ax.set_ylabel("")
    ax.set_xlim([0, 100])

fig.tight_layout()
plt.show()
Total running time of the script: (0 minutes 1.708 seconds)