CHECK_SWATINIT
check_swatinit is a tool to quality check water initialization in Eclipse runs where the keyword SWATINIT has been used. The tool will quantify how much the volume changes from SWATINIT to SWAT at time zero in the dynamical model, and help understand why it changes.
The tool has multiple outputs:
A CSV file listing every cell with relevant information. Analyse in Spotfire for deeper insight All other outputs listed below are simple numbers extracted from this table.
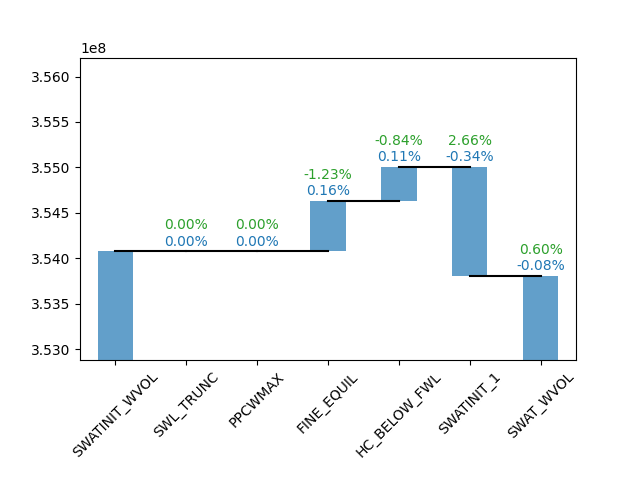
A text table printed to the terminal/stdout summarizing volumetric changes from SWATINIT to SWAT by QC category. This can also be plotted as a waterfall chart.
A text table with maximum capillary pressure pr. input SATNUM
A text table with maximum capillary pressure scaling pr. EQLNUM and SATNUM.
A plot panel with scatter plot of a parameter vs depth for every cell. This plot panel is individual pr. EQLNUM.
The Eclipse keyword SWATINIT
SWATINIT is used as a tool to conserve the water saturation modelling done in the geomodel. However, SWATINIT will not set the “initial” water saturation in the Eclipse run, it will only scale the capillary pressure table on a cell by cell basis, with exceptions. This tool will assess the impact of these exceptions.
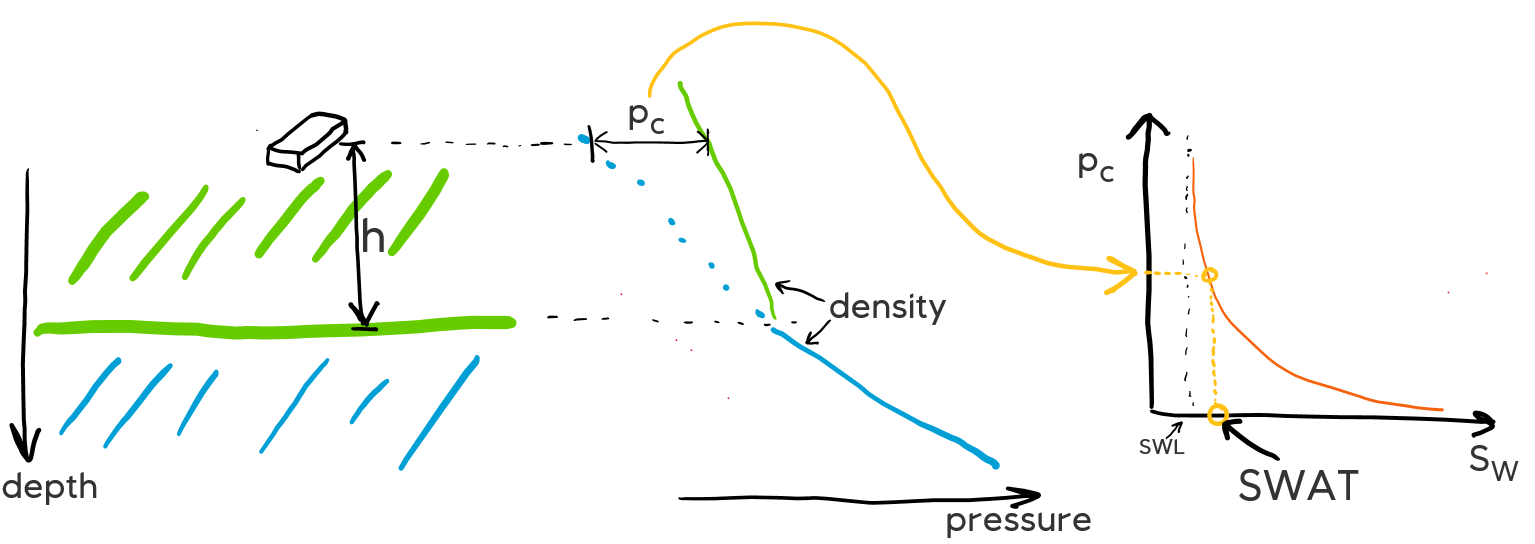
Water saturation initialization in Eclipse at time zero is always performed using the capillary pressure function from the SWOF/SWFN tables, this is in order to maintain initial dynamical stability. The impact of SWATINIT is only to allow for cell-by-cell scaling of the capillary pressure function before it is used for initialization.

Illustration of the water initialization in Eclipse. If SWATINIT is in use the capillary pressure curve to the right is scaled vertically up or down such that the computed SWAT matches the requested SWATINIT value for the specific cell.
Cell by cell outcome of water initialization
The tool assesses each cell in the dynamical model individually, and flags
them according to what has happened from SWATINIT to SWAT. The flag will be
included in the QC_FLAG column of the outputted CSV. The possible outcomes
are:
PC_SCALEDCapillary pressure have been scaled and SWATINIT was accepted. Zero volumetric change, but check the maximum capillary pressure pr SATNUM in each EQLNUM to ensure extreme values were not necessary.
FINE_EQUILIf item 9 in EQUIL is nonzero (default in Eclipse 100 is -5), then initialization in Eclipse happens in a vertically refined model for the reservoir cell. Capillary pressure is still scaled, but water might be added or lost. The estimated scaling of capillary pressure and estimated capillary pressure by check_swatinit is only approximate.
SWL_TRUNCIf SWL, as given to Eclipse through SWOF or through the SWL keyword, is larger than SWATINIT, SWAT will be reset to SWL. Compared to SWATINIT, extra water is added to the model and hydrocarbons are lost. If this amounts to significant volumes, revise the modelling.
SWATINIT_1When SWATINIT is 1 above the contact, Eclipse will ignore SWATINIT in the cell and not touch the capillary pressure function. This will typically result in extra hydrocarbons added to the model for a normal capillary pressure function. This could be ok as long as the porosities and/or permeabilities of these cells are small. If it is not, you should look into if there are upscaling issues for this cell. In situations with nonzero item #9 in EQUIL, this can also occur below the contact. If SWU is included in the model and less than 1, cells where SWATINIT is equal or larger than SWU will also be flagged as SWATINIT_1 as the behaviour is the same.
HC_BELOW_FWLIf SWATINIT is less than 1 below the contact provided in EQUIL, Eclipse will ignore it and not scale the capillary pressure function. SWAT will be 1, unless a capillary pressure function with negative values is in SWOF/SWFN. If item #9 in EQUIL is zero, this should be expected for cells below the contact. For nonzero item #9, it can also happen for cells with SWAT < 1.
PPCWMAXIf the DATA file includes the PPCWMAX keyword, there will be an upper limit to how much scaling is allowed in order to match SWATINIT. When this limit is hit, SWAT in Eclipse will be less than SWATINIT and water is lost. If you need to use PPCWMAX you should revisit the modelling.
WATERSWATINIT was 1 in the water zone, and SWAT is set to 1.
Text output from check_swatinit
When run interactively in a terminal on an Eclipse case, check_swatinit will print a text output summarizing the results from flagging each cell into distinct QC categories. The table below sums the water volume changes from SWATINIT to SWAT for each QC category, in terms of reservoir volumes, i.e. no conversion to surface conditions. The percentages are with respect the SWATINIT_WVOL (i.e. the water volume that SWATINIT requested).
To the right in the output, the corresponding hydrocarbon porevolumes under reservoir conditions are given. The number 66.571 is SWATINIT_WVOL substracted from PORV, and then the percentages below are the volumetric change in water volume with respect to this hydrocarbon pore volume.
$ check_swatinit DROGON-EXAMPLE.DATA
VOLUME                     3203.1103 Mrm3
PORV                        571.1770 Mrm3
SWATINIT_WVOL               504.6057 Mrm3           HC:   66.571 Mrm3
+ FINE_EQUIL                  0.0000 Mrm3   0.00 %         0.00 %
+ HC_BELOW_FWL                0.6500 Mrm3   0.13 %        -0.98 %
+ PPCWMAX                     0.0000 Mrm3   0.00 %         0.00 %
+ SWATINIT_1                  0.0000 Mrm3   0.00 %        -0.00 %
+ SWL_TRUNC                   1.2752 Mrm3   0.25 %        -1.92 %
= SWAT_WVOL                 506.5309 Mrm3   0.38 %        -2.89 %


Maximal values:
---------------
          PCOW_MAX
SATNUM
1       165.728152
                    PPCW  PC_SCALING
EQLNUM SATNUM
1      1       22.626438    0.136527
The maximal values tables then gives the maximum capillary pressure as present in the input SWOF/SWFN table (the number PCOW_MAX) for each SATNUM. The number PPCW in the next table is the corresponding number after Eclipse has scaled the capillary pressure, and you can find here that PPCW = PCOW_MAX * PC_SCALING. In the ideal case (no error from upscaling etc), PC_SCALING would be 1 in all cells. Since PC_SCALING is less than 1 it means that capillary pressure had to be downscaled by at least a factor ~10 in every cell, meaning that the capillary pressure input curve should be revisited.
Use also the scatter plot through the --plot option to get an impression
of which capillary pressures ranges are present in your reservoir model.
More often, PC_SCALING and PPCW will be large, with scaling larger than 1. Still, this table only prints the maximal values, and if severe PC_SCALING only occurs in a few cells, it could still be acceptable.
Outputted CSV file
Through the --output option, a CSV file can be written containing
information for every cell. This can be used for further analysis, either by
numerically or visually. The CSV file contains grid data from the EGRID file
(I, J, K, and X, Y, Z for the cell centres), and basic
properties. The column SWAT contains the water saturation from the UNRST file,
at the first time step. Do not use this tool on restart runs.
From the EQUIL section in the input deck (DATA-file), the datum, pressure and
contacts are included, and the item #9 setting, called OIP_INIT.
The PCW column contains the values provided in the PCW keyword in the deck
if it is used (seldom). Usually it is identical to the data in the PPCW
column, which is obtained from the UNRST file. PPCW contains the maximum
capillary pressure allowed in a cell after initialization, that means if
SWATINIT successfully scaled the capillary pressure. The maximum capillary
pressure in the input tables SWOF/SWFN is found in the column PCOW_MAX, and
the scaling factor (the ratio between PPCW and PCOW_MAX) is found in
the column PC_SCALING.
The PC column is an estimate of the capillary pressure in the cell after
Eclipse initialization. It is back-computed from SWAT and the scaled capillary
pressure function from SWOF/SWFN. Beware that this will not be correct for all
cells when item #9 in EQUIL is nonzero.
Example plots

A waterfall chart illustrating what contributes to the change from SWATINIT
to SWAT. This plot is obtained by adding the --volplot command line
option. The numbers inside the plot are the percentage changes in terms of
reservoir volumes, blue numbers are with respect to SWATINIT_WVOL and green
numbers are with respect to initial hydrocarbon volumes.

A panel of reservoir properties versus depth, coloured by the QC_FLAG, for a
specific EQLNUM. Use the command line option --plot together with
--eqlnum to obtain this.
Command line syntax
QC tool for SWATINIT vs SWAT in Eclipse runs
usage: check_swatinit [-h] [-o OUTPUT] [--volplot] [--volplotfile VOLPLOTFILE]
                      [--plot] [--plotfile PLOTFILE] [--eqlnum EQLNUM]
                      [--version]
                      DATAFILE
Positional Arguments
- DATAFILE
Eclipse DATA-file for a finished run with restart data. It is also possible to provide a CSV file that has earlier been exported by this tool, which will trigger a rerun of the volumetric report and plotting.
Named Arguments
- -o, --output
Output filename for CSV that can be used for QC in other tools
Default:
''- --volplot
Display a waterfall chart with the water saturation volumes from SWATINIT to SWAT
Default:
False- --volplotfile
PNG filename for where to dump a waterfall chart.
- --plot
Show scatter QC plots with one dot pr. reservoir cell in a given EQLNUM region, use together with the –eqlnum option
Default:
False- --plotfile
PNG filename for where to dump a QC plot.
- --eqlnum
Which EQLNUM to plot for in scatter plots. Defaults to 1. Does not affect CSV output
Default:
1- --version
show program’s version number and exit