SUMMARYPLOT
summaryplot is a command line utility to generate plots from Eclipse
simulations, based on resdata
for processing Eclipse output files and
matplotlib for plotting.

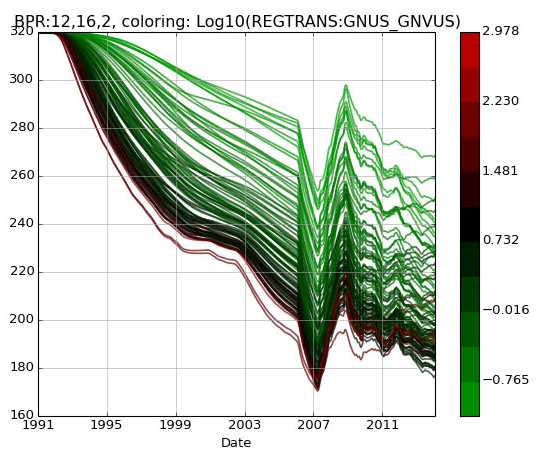
Example plot produced by summaryplot, lines coloured by an ERT input parameter,
summaryplot -nl -cl REGTRANS:GNUS_GNVUS BPR:12,16,2 realization-*/iter-1/*DATA
Syntax
Summaryplot will plot summary vectors from your Eclipse output files.
To list summary vectors for a specific Eclipse output set, try:
summary.x --list ECLFILE.DATA
Command line argument VECTORSDATAFILES are assumed to be Eclipse DATA-files as long as the command line argument is an existing file. If not, it is assumed to be a vector to plot. Thus, vectors and datafiles can be mixed.
usage: summaryplot [-h] [-H] [-n] [--nolegend] [--maxlabels MAXLABELS] [-e]
                   [-d] [-c COLOURBY] [--logcolourby LOGCOLOURBY]
                   [--singleplot] [-v] [--version]
                   VECTORSDATAFILES [VECTORSDATAFILES ...]
Positional Arguments
- VECTORSDATAFILES
List of vectors to plot and/or DATA-files to include
Named Arguments
- -H, --hist
Add historical vectors
Default:
False- -n, --normalize
Normalize the values pr. vector to (0,1)
Default:
False- --nolegend, --nolabels
Drop legend
Default:
False- --maxlabels
Max number of vector names in legend
Default:
5- -e, --ensemblemode
Colour by vector instead of by DATA-file
Default:
False- -d, --dumpimages
Dump images to files instead of displaying on screen
Default:
False- -c, --colourby
Colourize curves by a value found in parameters.txt
- --logcolourby
Colourize curves by the logarithm of a value found in parameters.txt
- --singleplot, -s
All vectors are put into one single plot
Default:
False- -v, --verbose
Be verbose
Default:
False- --version
show program’s version number and exit
The script is forgiving for incomplete filenames, if you want to read PERFECTMATCH.DATA it is sufficient to write “PERFECTMATCH” OR “PERFECTMATCH.” (this feature is there to save time when you tab yourself to filename completion).
Vectors can be written with wildcards. For a list of possible vectors, issue
summary.x --list <eclipsedatafile>. If using the c-shell (csh), you
need to enclose each vector wildcard in quotes.

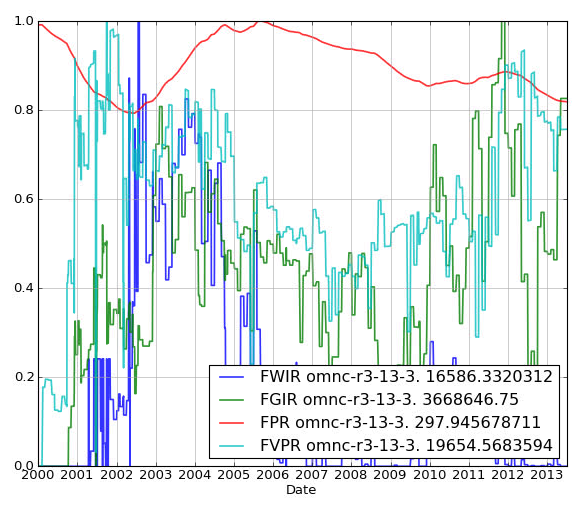
Example with normalize option,
summaryplot -n -s FWIR FGIR WPR FVPR MYSIMULATION.DATA

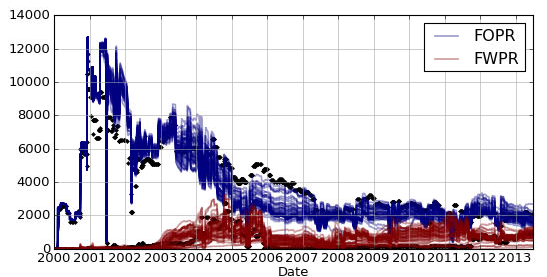
Example with ensemble mode,
summaryplot -e -H -s FOPR FWPT realization*/*DATA was used to produce
this example. Transparency is adjusted according to number of models plotted.
Plotting cell values
Cell values (f.ex. SWAT, SOIL, PRESSURE) can be plotted by giving
vector names like keyword:i,j,k, f.ex:
$ summaryplot SOIL:14,32,1 FILENAME.DATA
This requires the relevant information to be available in a unified restart file.